Forecast vs. reality
Compare what a finished run predicted with what really sold afterwards: a verdict in plain words, the error per product, and a back-test to measure without waiting for the future.
On this page
The Forecast vs. reality screen answers one question: can I trust this forecast? It takes a finished run, looks among your sales files for the ones with real sales on the dates that run forecast, and measures the difference. The forecasting engine does all the maths; the screen shows it and says it in words.
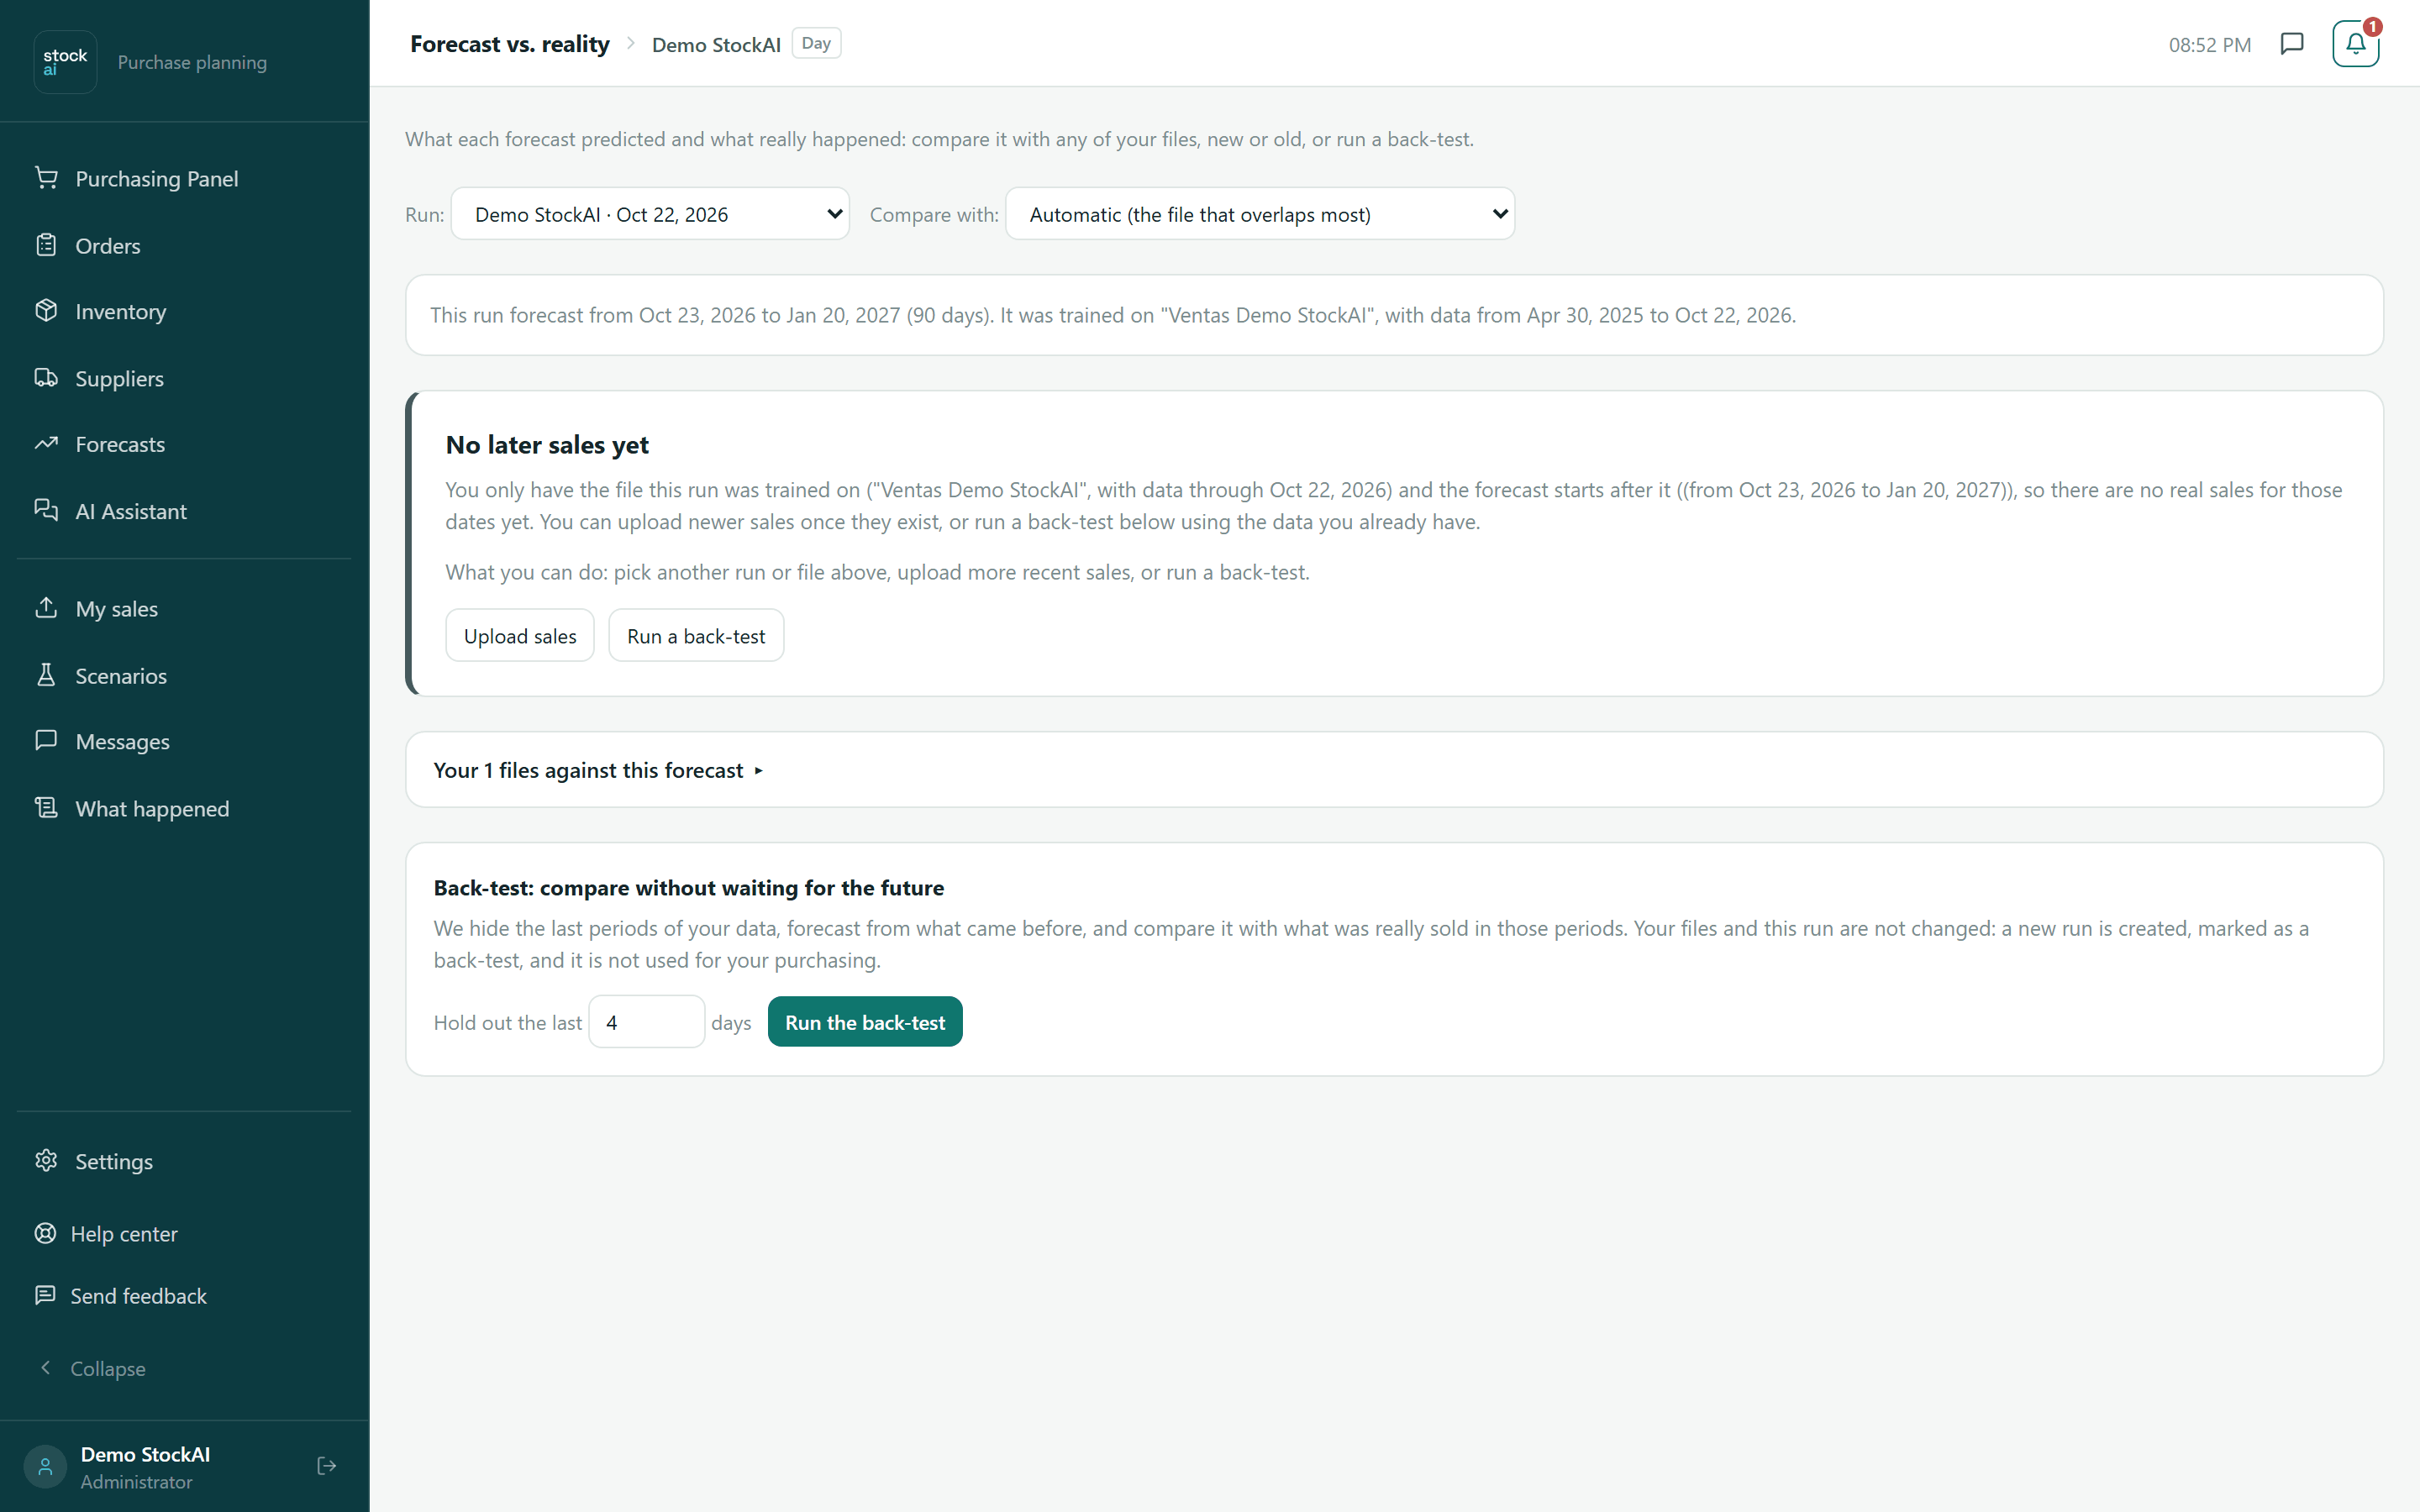
Choosing what to compare
- Run:
- All your finished runs, archived ones included (marked “(Archived)”) and back-tests (marked “(Back-test)”), newest first. On opening, the screen picks the run in the link (
?session=), else the one the app plans from, else the most recent. - Compare with:
- The file with the real sales. By default “Automatic (the file that overlaps most)”: StockAI picks the file whose dates best cover the forecast period. You can force any other, new or old; each option shows its name and date range.
Under the selectors a card sums up the run: “This run forecast from … to … (N days/weeks/months).” and “It was trained on "file", with data from … to ….” A back-test says so: “This is a back-test: it was trained without the last N periods and is compared with the full file.”
The two automatic cards
They appear only when they have something to say.
- Automatic tracking
- Compares the run’s error against real sales with its error at training time. It says “The forecast is performing N% worse than when it was trained.”, “The forecast is holding in line with its training accuracy.”, that there are still too few sales to judge, or that the run kept no training accuracy. It updates itself when you upload new sales. It is a notice: nothing retrains automatically.
- Value of your forecast adjustments
- Only if someone adjusted this run’s forecast by hand (in Consensus or in Forecasts). It compares each adjustment with the model’s untouched forecast on the same real sales: “Your adjustments improved/worsened the forecast error by N%”, on how many points it landed closer or farther, and the direction of the error (model → adjustment). With more than one person or reason it breaks it down per person and per reason. If sales for those periods have not arrived yet, it says how many adjustments are waiting to be measured.
The verdict and the indicators
When there are real sales to compare, a card says which file was used (“Compared with "…" (uploaded …), with sales up to ….”), how many forecast periods could be compared, and the verdict:
| Verdict | When |
|---|---|
| “Your forecasts are on target” | Weighted error (WAPE) of 20% or less. |
| “Your forecasts are usable but loose” — keep a safety cushion | WAPE between 20% and 40%. |
| “Your forecasts are not hitting the mark” — review your data or retrain | WAPE above 40%. |
| “There are still too few periods to judge” | Fewer than 5 points compared: no judgement is made. |
Below it, the direction of the error: “They tend to overshoot” (overstock risk), “They tend to fall short” (stock-out risk) or “No important bias”. It counts as bias when the forecast leans more than 10% to one side.
- Weighted error (WAPE)
- How far off the forecast was, measured against the units sold. Lower is better. It is the verdict’s number.
- Average error (MAPE)
- The average percentage error of each period; it weighs big and small products equally.
- Bias
- Positive: the forecast ran high. Negative: it ran low.
- Periods compared
- How many date-product pairs with both a forecast and a real sale were compared.
- Products
- How many products entered the comparison.
Hover an indicator’s name to read its explanation.
The chart and the per-product table
The “Forecast vs. actual” chart draws the forecast as a dashed line and what sold as a solid line. Hover a point to see its date and value. It starts with all products added up.
The “By product (the ones that missed most first)” table gives, per product: forecast, actual, weighted error, bias as a number and in words (“Over-forecast: ran above what sold”, “Under-forecast: ran below what sold”, “No bias”) and periods compared. If there are more products than fit, the footer says “Showing N of M products.”
- Click a product’s row: it is highlighted and the chart switches to “product {code}”, with its error and bias above it.
- Click “Show all” (top right of the chart) to go back to the total.
Your files against this forecast
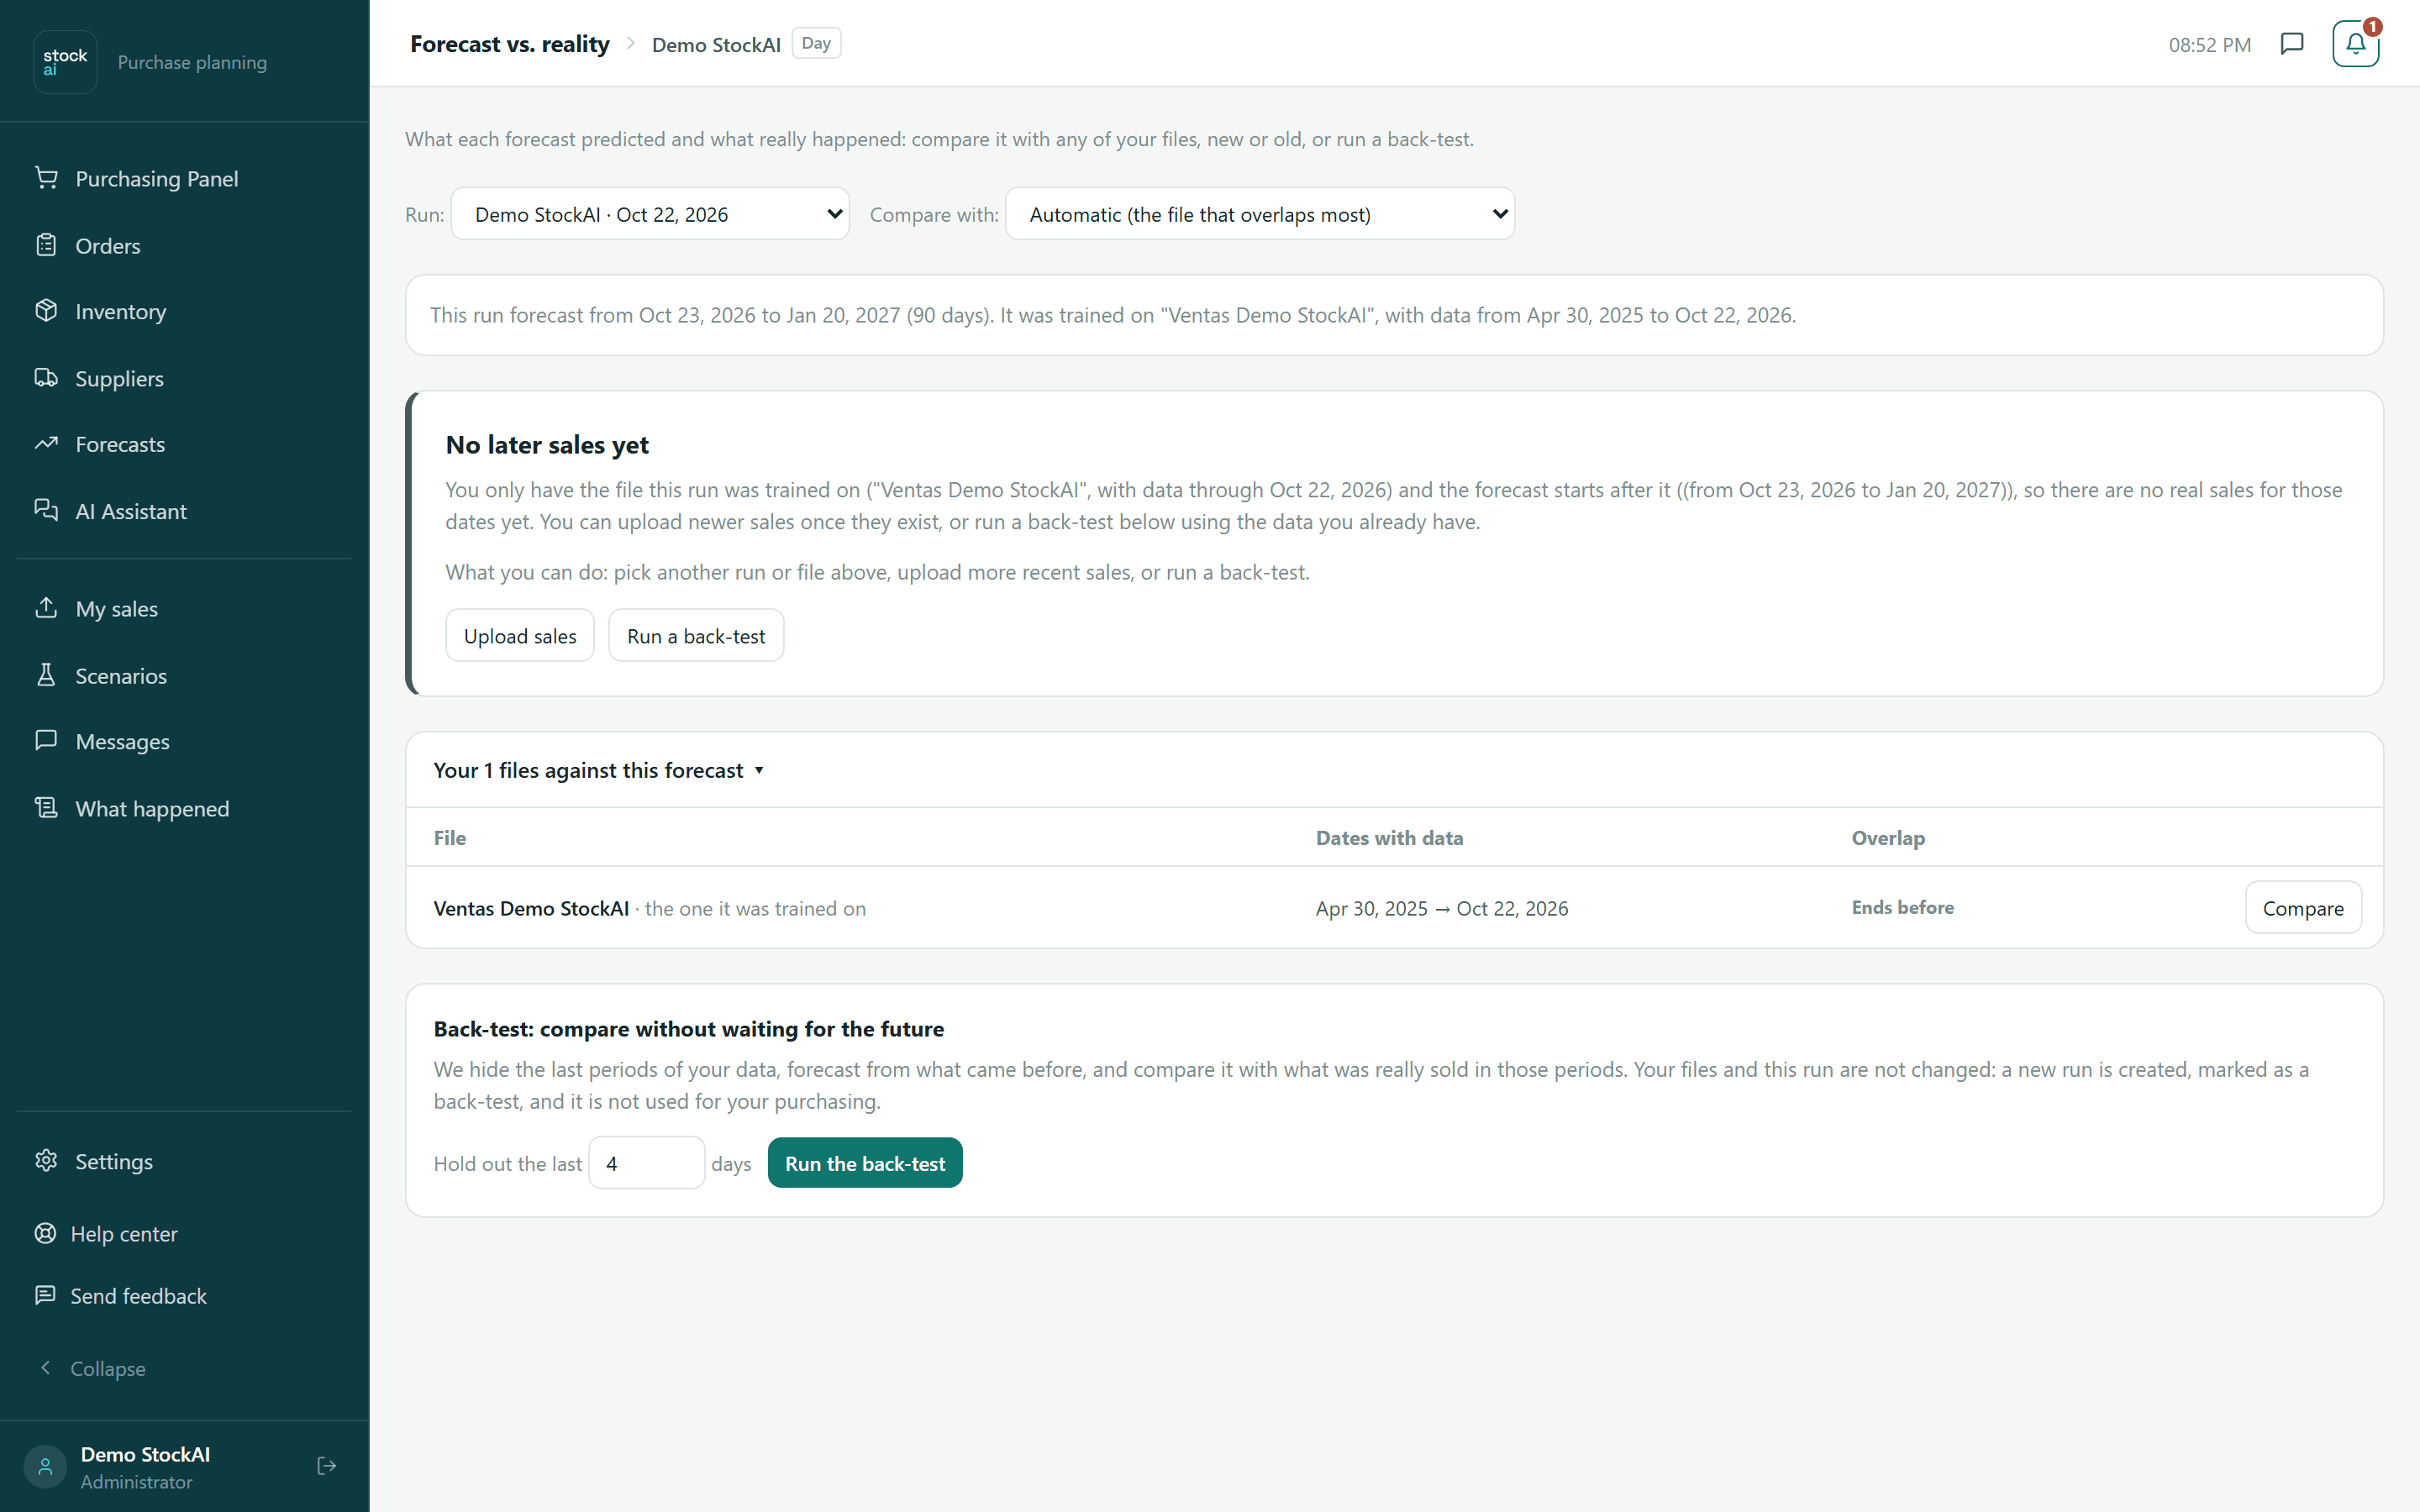
Click “Your N files against this forecast” to expand all your sales files. For each: name (the training file carries “the one it was trained on”), Dates with data and Overlap:
- Covers all
- Its dates cover the whole forecast period.
- Covers part
- Only part of the forecast dates.
- Ends before / Starts after
- It has no sales on the forecast dates.
- No dates
- The file’s dates could not be read.
- Different columns / No rows / Could not be read / Not checked yet
- The file lacks the run’s columns, is empty, could not be opened, or has not been checked yet.
Each row’s “Compare” button does the same as picking that file in “Compare with:”.
When there is nothing to compare
The screen never goes blank: it explains why it cannot measure and what to do. The cases are:
- No later sales yet
- You only have the file the run was trained on and the forecast starts after it. That is normal right after training.
- The new sales do not cover the forecast period
- The chosen file (or every file) has no sales on those dates. The file list shows how far each one reaches.
- The dates match, but the products do not
- Check that product codes are written the same way in both files.
- That file is no longer available
- Choose another one from the list.
- This run has no saved forecast
- Choose another finished run.
- We could not read the later sales
- The file does not have the columns the run used, or it could not be opened.
Each notice carries two buttons: “Upload sales” (takes you to Files) and “Run a back-test” (scrolls down to the back-test card).
Back-test: measure without waiting for the future

If you do not want to wait for new sales, a back-test hides the last periods of your data, forecasts from what came before, and compares it with what really sold in those periods.
- Pick the Run you want to test at the top.
- In “Hold out the last” type how many periods to hide (in the run’s unit: days, weeks or months; 4 by default).
- Click “Run the back-test”. The button shows “Starting…”.
- You will see “Done: the calculation started with data through …”. It takes a few minutes; the “See the history” link takes you to History to follow it.
- When it finishes, pick it under “Run” (it is listed as “Back-test: … (last N held out)”) to see the comparison.
Related
- Forecasts: the forecast evaluated here, with a direct link to this screen.
- History: every run, back-tests included.
- How the models compete: the accuracy measured at training time.