Impact & ROI
The record of what you did with StockAI: orders generated, urgent lines ordered, purchase value managed, how often you followed the recommendations, and how your overstock changed month by month.
On this page
Impact & ROI adds up records the app already wrote: the orders you generated, the decisions you made on each recommendation, and the monthly measurements of your inventory. It is read-only and every role can see it.
Monthly recap
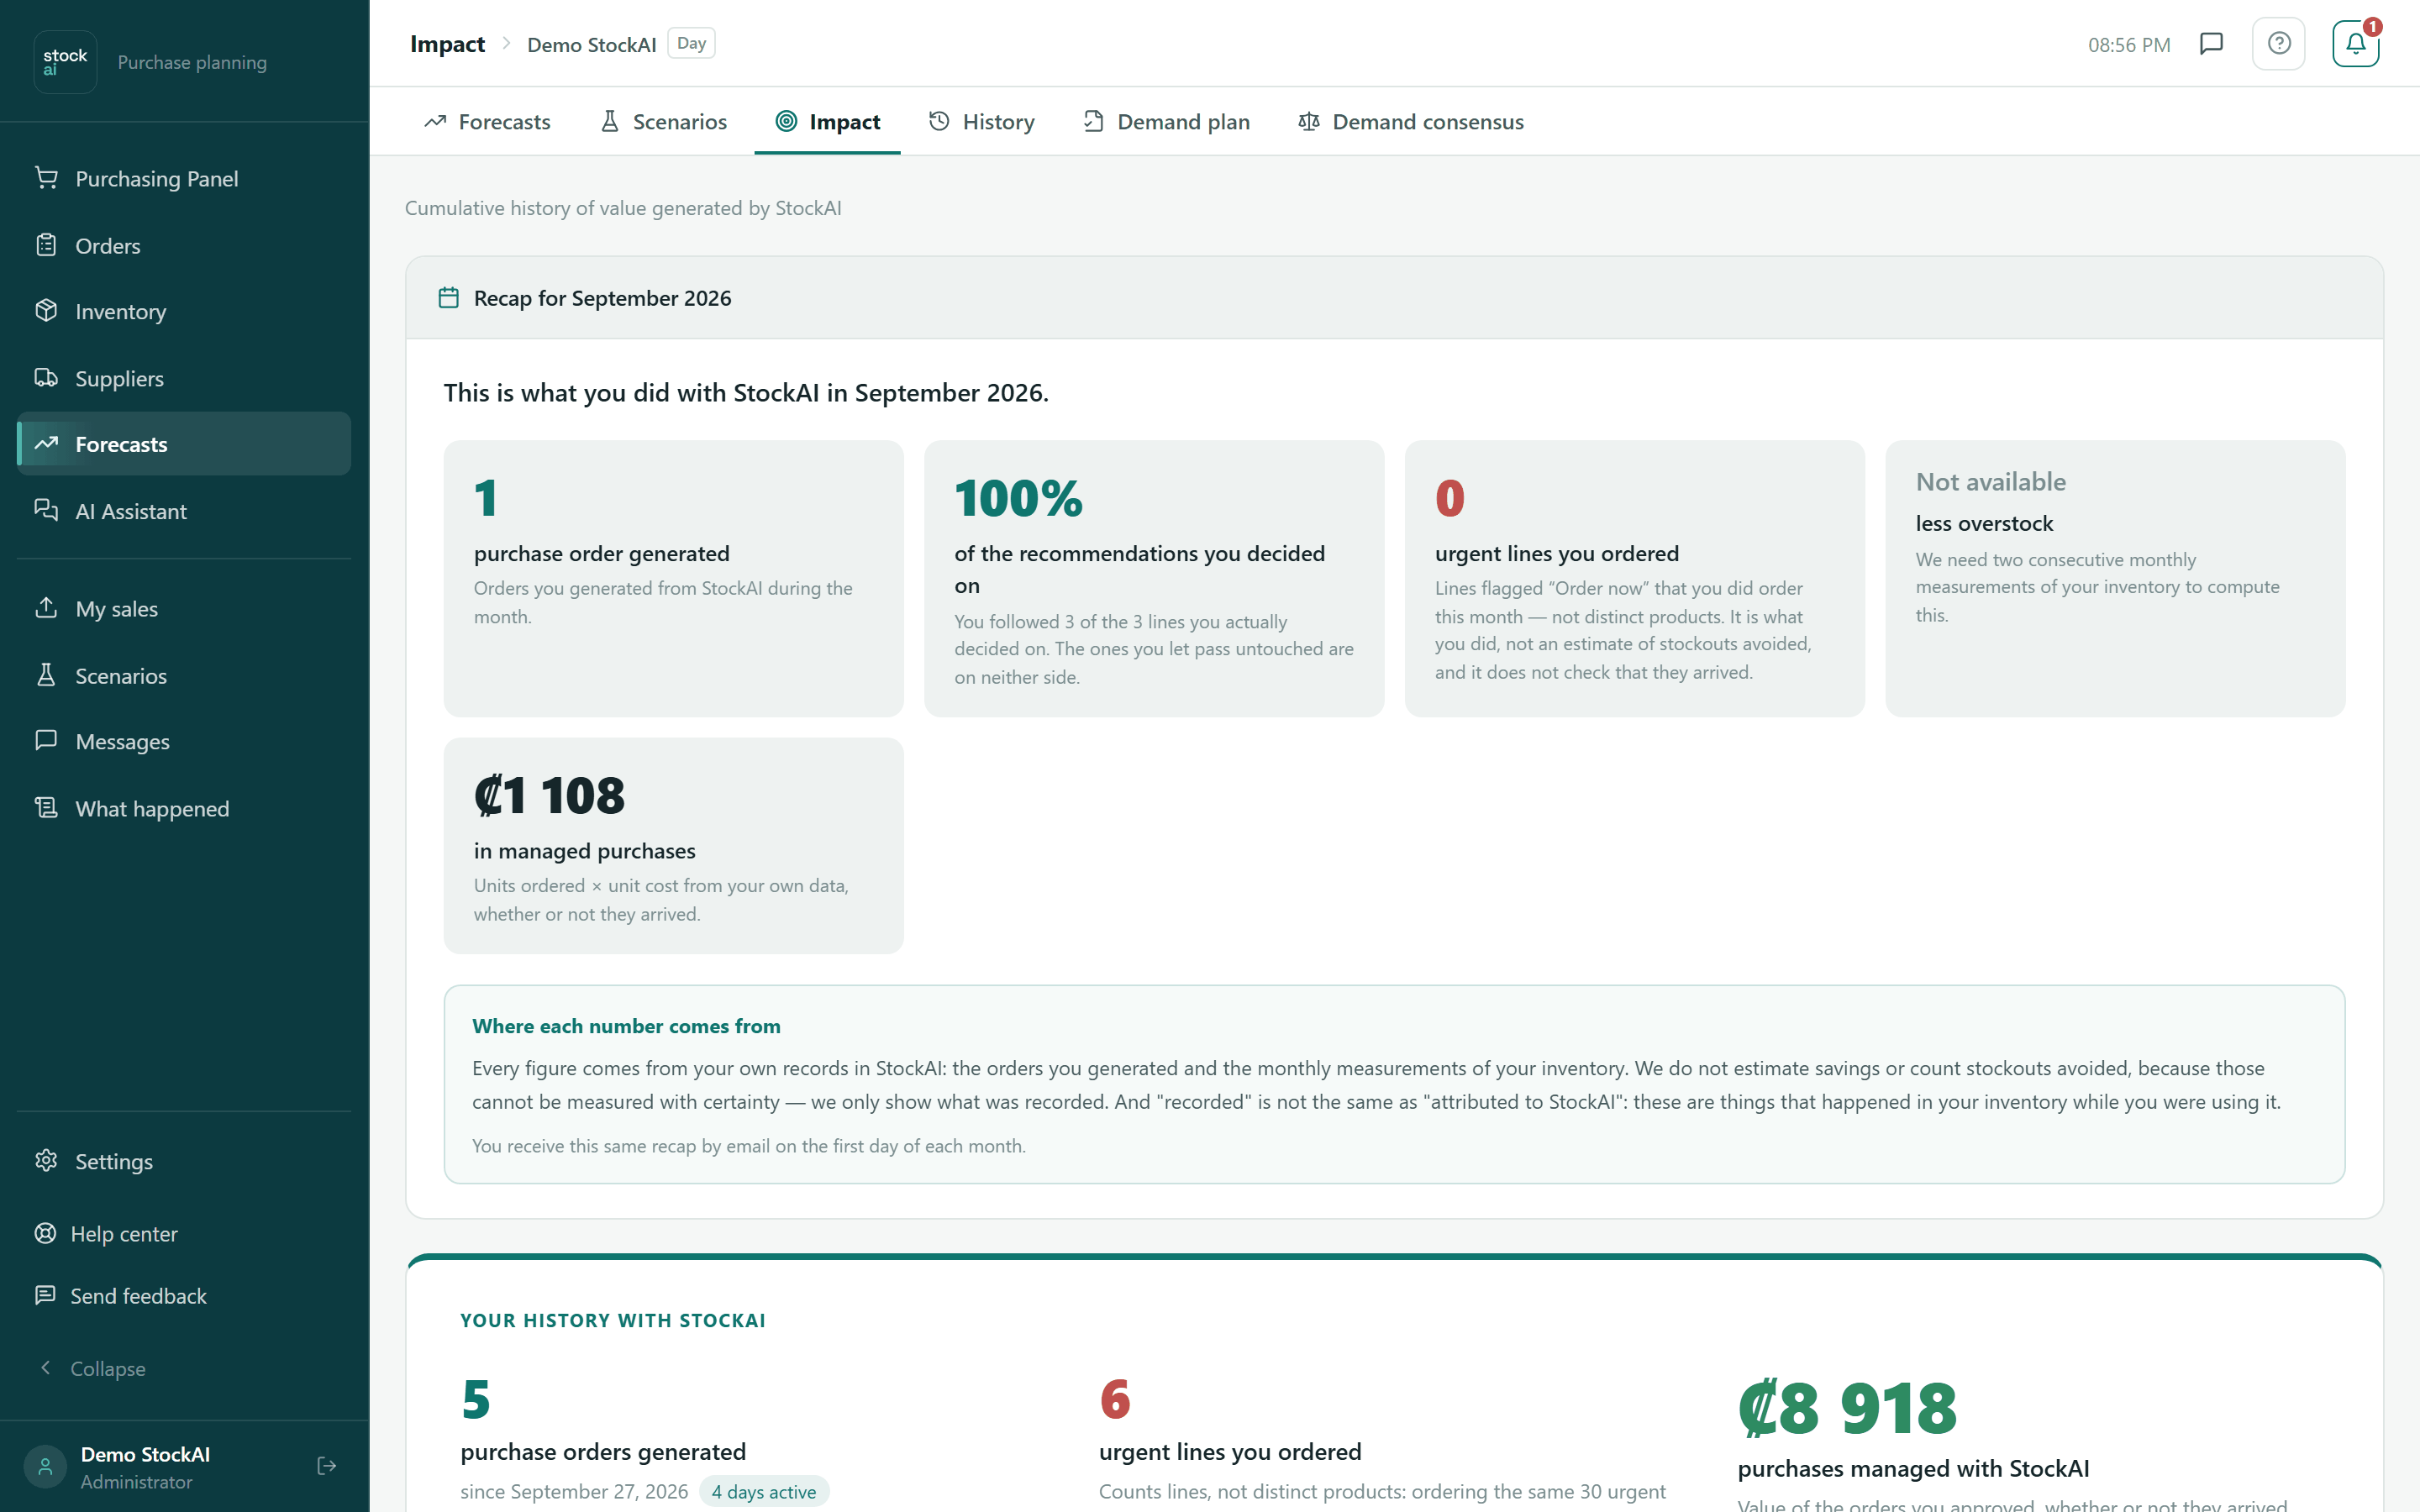
The first card, “Recap for {month}”, always covers the last closed month and is the same recap you receive by email on the first day of each month. Its headline says how much your idle inventory dropped, or “This is what you did with StockAI in {month}.” when there is no drop to show.
- purchase orders generated
- Orders you generated from StockAI during the month.
- of the recommendations you decided on
- The adoption percentage: you followed N of the N lines you actually decided on. The ones you let pass untouched are on neither side. Shown only if there were decisions.
- urgent lines you ordered
- Lines flagged “Order now” that you did order this month. It counts lines, not distinct products, and does not check that they arrived.
- less overstock
- The difference between the value of your overstocked inventory at the start and the end of the month. Overstock also falls when you sell, record shrinkage, delete products or retrain, so it is not all down to your purchasing. It says “Not available” without two consecutive measurements, and explains separately when overstock grew (that is not missing data).
- in managed purchases
- Units ordered times unit cost, whether or not they arrived. Prefixed with “≥” when only some lines carried a cost: the real value is at least that. “Not available” if no product has a cost.
The “Where each number comes from” box explains this on the screen itself. If no order was recorded that month, the card says “Not enough history to compute this yet”.
Your history with StockAI
- purchase orders generated
- The total since the first one, with the date (“since …”) and the days active.
- urgent lines you ordered
- Every urgent line you ordered. It counts lines: ordering the same 30 urgent items every month for a year adds up to 360. It includes orders that have not arrived.
- purchases managed with StockAI
- The value of the orders you approved, whether or not they arrived. If your products have no unit cost, you see total units ordered instead, with a hint to add costs.
Confidence in recommendations
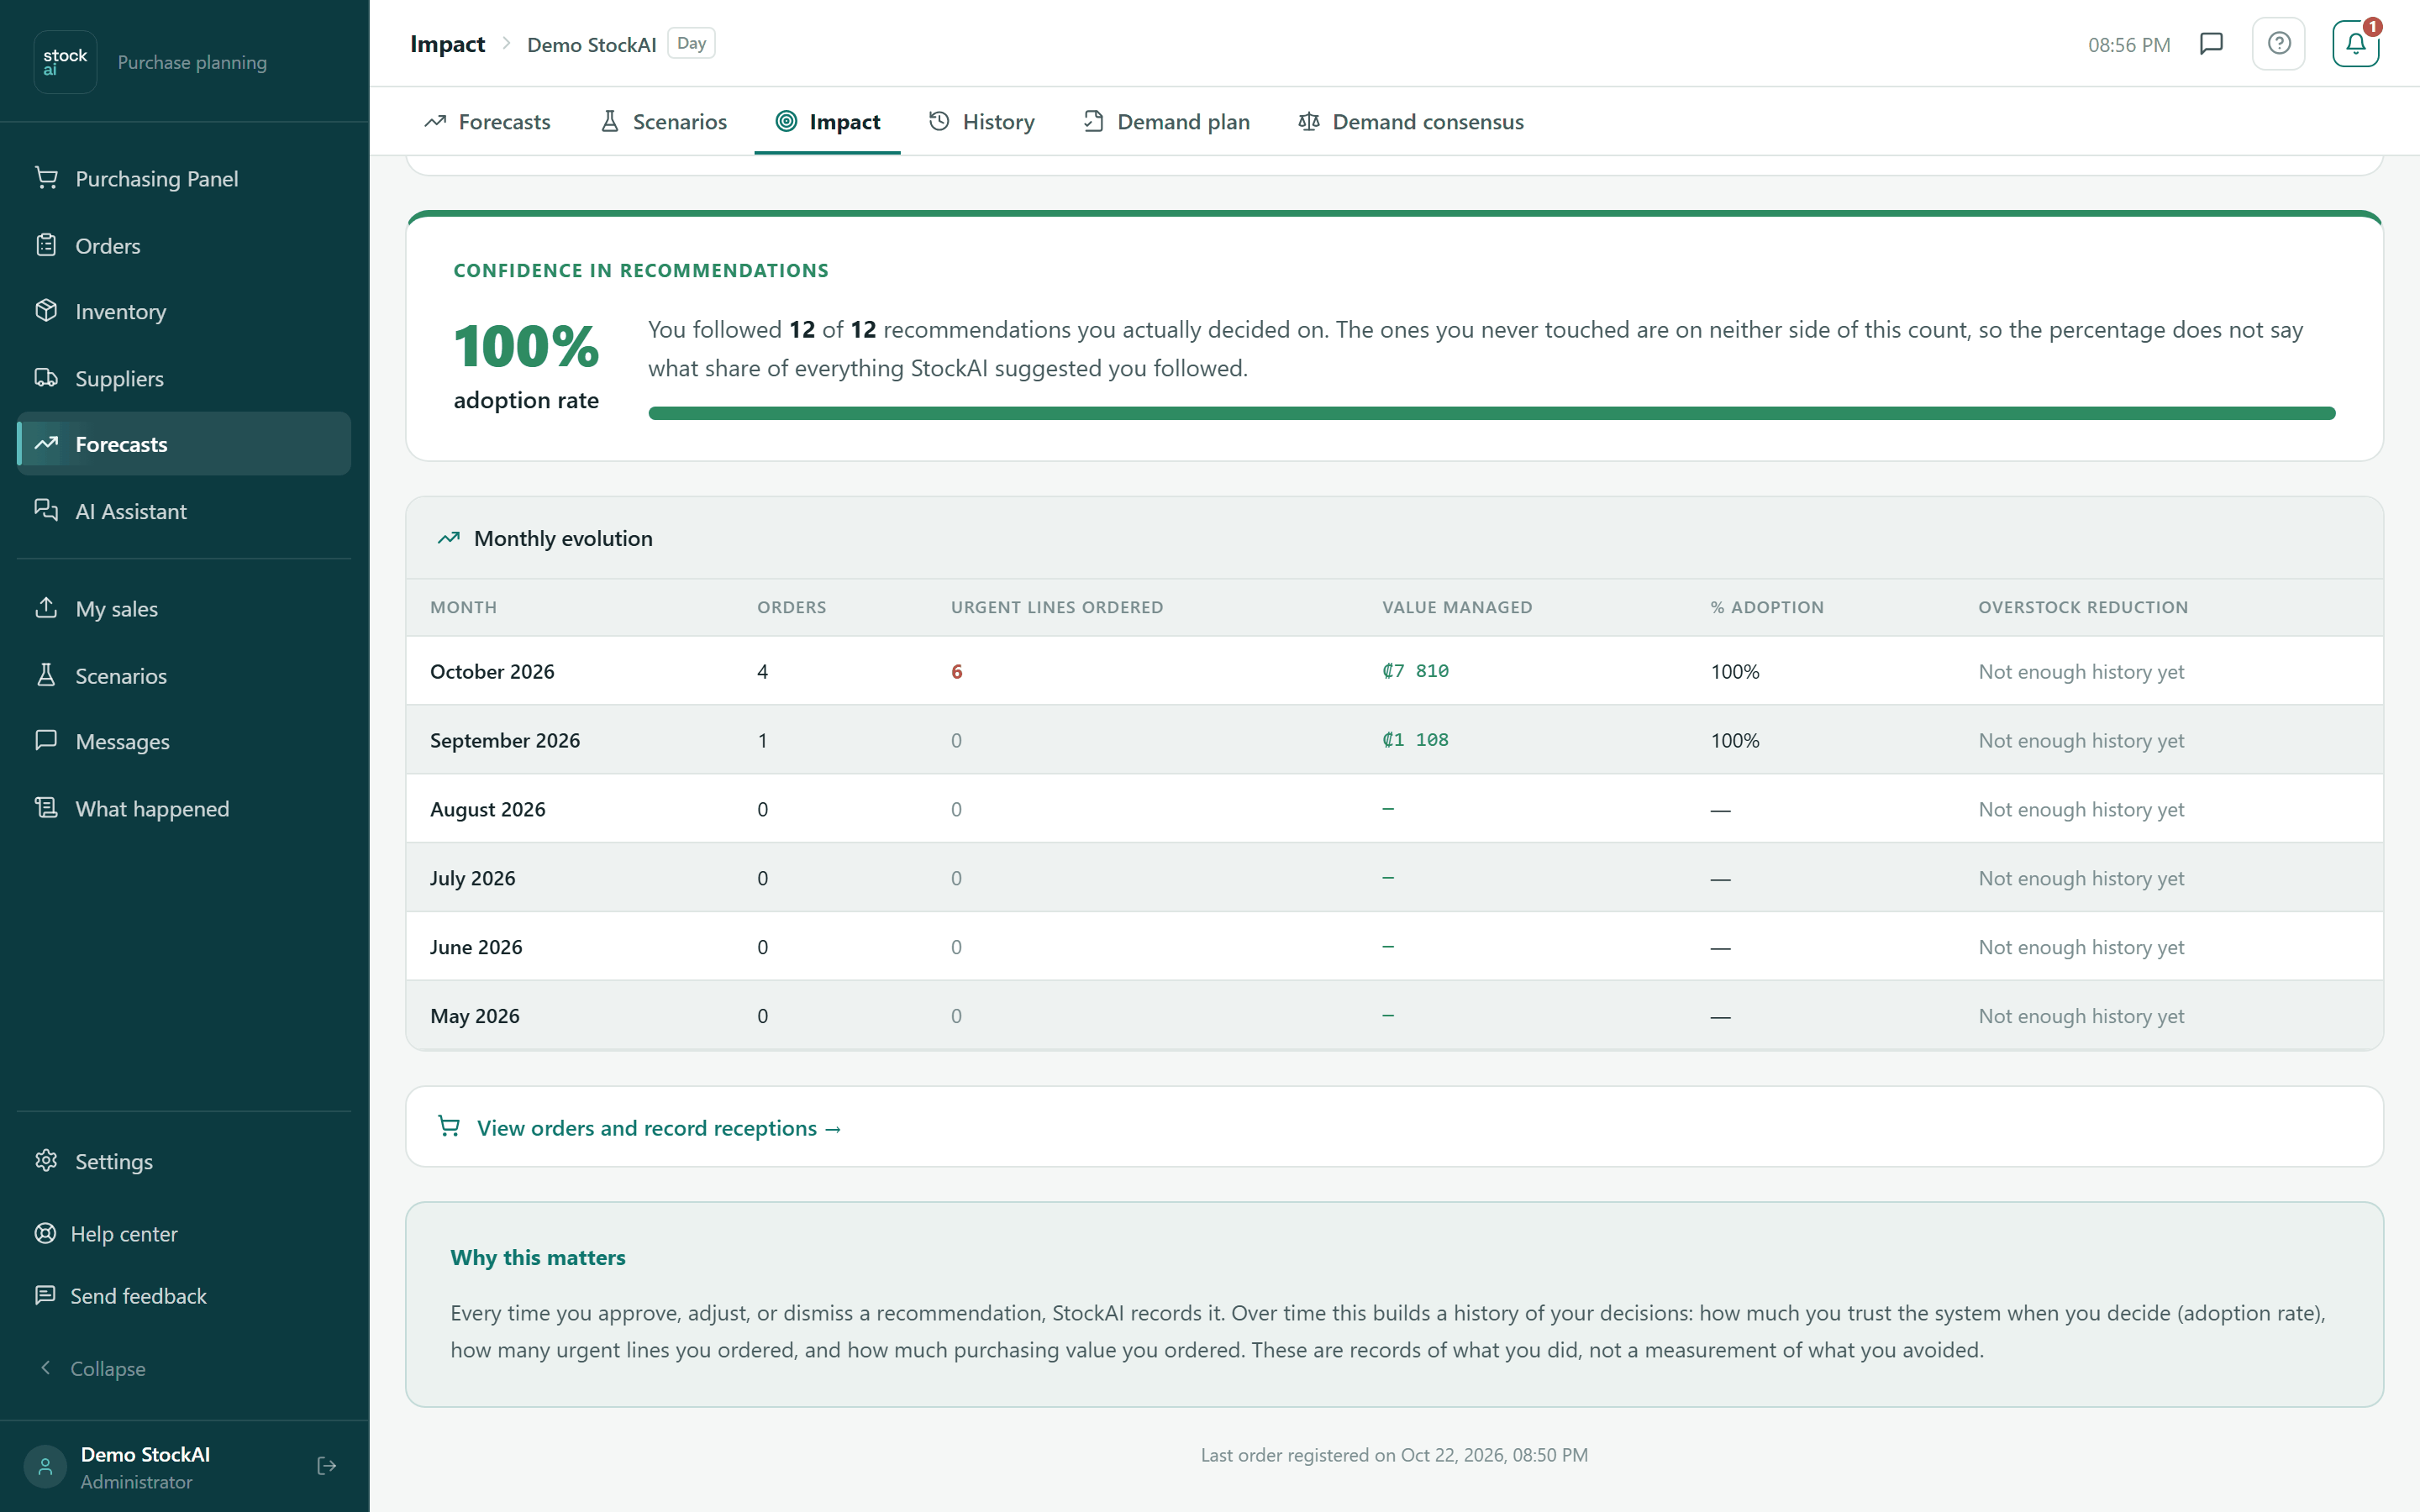
It appears once decisions are recorded (you approved or rejected lines in the Purchasing panel). It shows the adoption rate as a percentage and a bar: green from 70%, amber from 40%, red below. Underneath, “You followed N of M recommendations you actually decided on” and how many you dismissed — useful for fine-tuning lead times or service levels.
Monthly evolution
- Month
- Each month with activity.
- Orders
- Orders generated that month.
- Urgent lines ordered
- In red when there are any.
- Value managed
- Value of the month’s orders, or “—” without costs.
- % Adoption
- That month’s adoption rate, or “—” without decisions.
- Overstock reduction
- How much the overstock value dropped, “Your overstock went up this month” or “Not enough history yet”.
On a phone each month is a card; tapping it opens a sheet with the five figures.
At the bottom of the screen
- “View orders and record receptions →” takes you to Orders.
- “Why this matters” explains that these figures are records of what you did, not a measurement of what you avoided.
- With no orders yet, the “No orders registered yet” block with the “Go to Inventory” button.
- The date of the last order registered.
For the screen to have figures, generate orders from the Purchasing panel and record your products’ unit cost in Inventory.