Forecasts
Each product’s forecast: how much is expected to sell, how long your stock lasts and what to order, in the buyer view; and the models, their errors, data quality and the comparison between runs, in the technical view.
On this page
Forecasts shows a run’s result product by product: the list on the left, the chosen product with its chart and tabs on the right. On opening, it picks the run the app plans from (or the one in the link, if you come from History) and the most urgent product.
The top bar
- Buyer view / Technical view
- The main switch. The buyer view shows what helps you buy; the technical one adds models, metrics, quality and comparison. The screen remembers your choice, and
?view=techin the link opens the technical one. - Forecast vs. reality
- Link to Forecast vs. reality (technical view).
- Export all products
- Technical view: an Excel file with one sheet per product (date, history, forecast and range). It shows progress “N / M Products…” and, if any fail, how many.
- Compare
- Technical view, with at least two finished runs: compares runs on the same chart (see below).
- Update:
- The run picker. Back-tests carry their tag; they are never picked automatically.
- Refresh
- Reloads the open run’s data.
Two notices may appear below: “Update with the new sales” when you have uploaded sales newer than the forecast (it creates a new forecast with the same models, without retraining them, and leaves this one untouched), and the collapsed panel with the run’s warnings (problems the engine found in your data while training).
The product list
- Search products…
- By code or name. The header says “N of M products”.
- Sort products by
- Urgency (what needs ordering first), Impact (quantity to order times cost) or Accuracy.
- Each row
- Code and name, the signal, the quantity “to order” (or “Nothing to order”), how often the model is right (“Right N% of the time”) and a mini curve of recent stock.
Buyer view
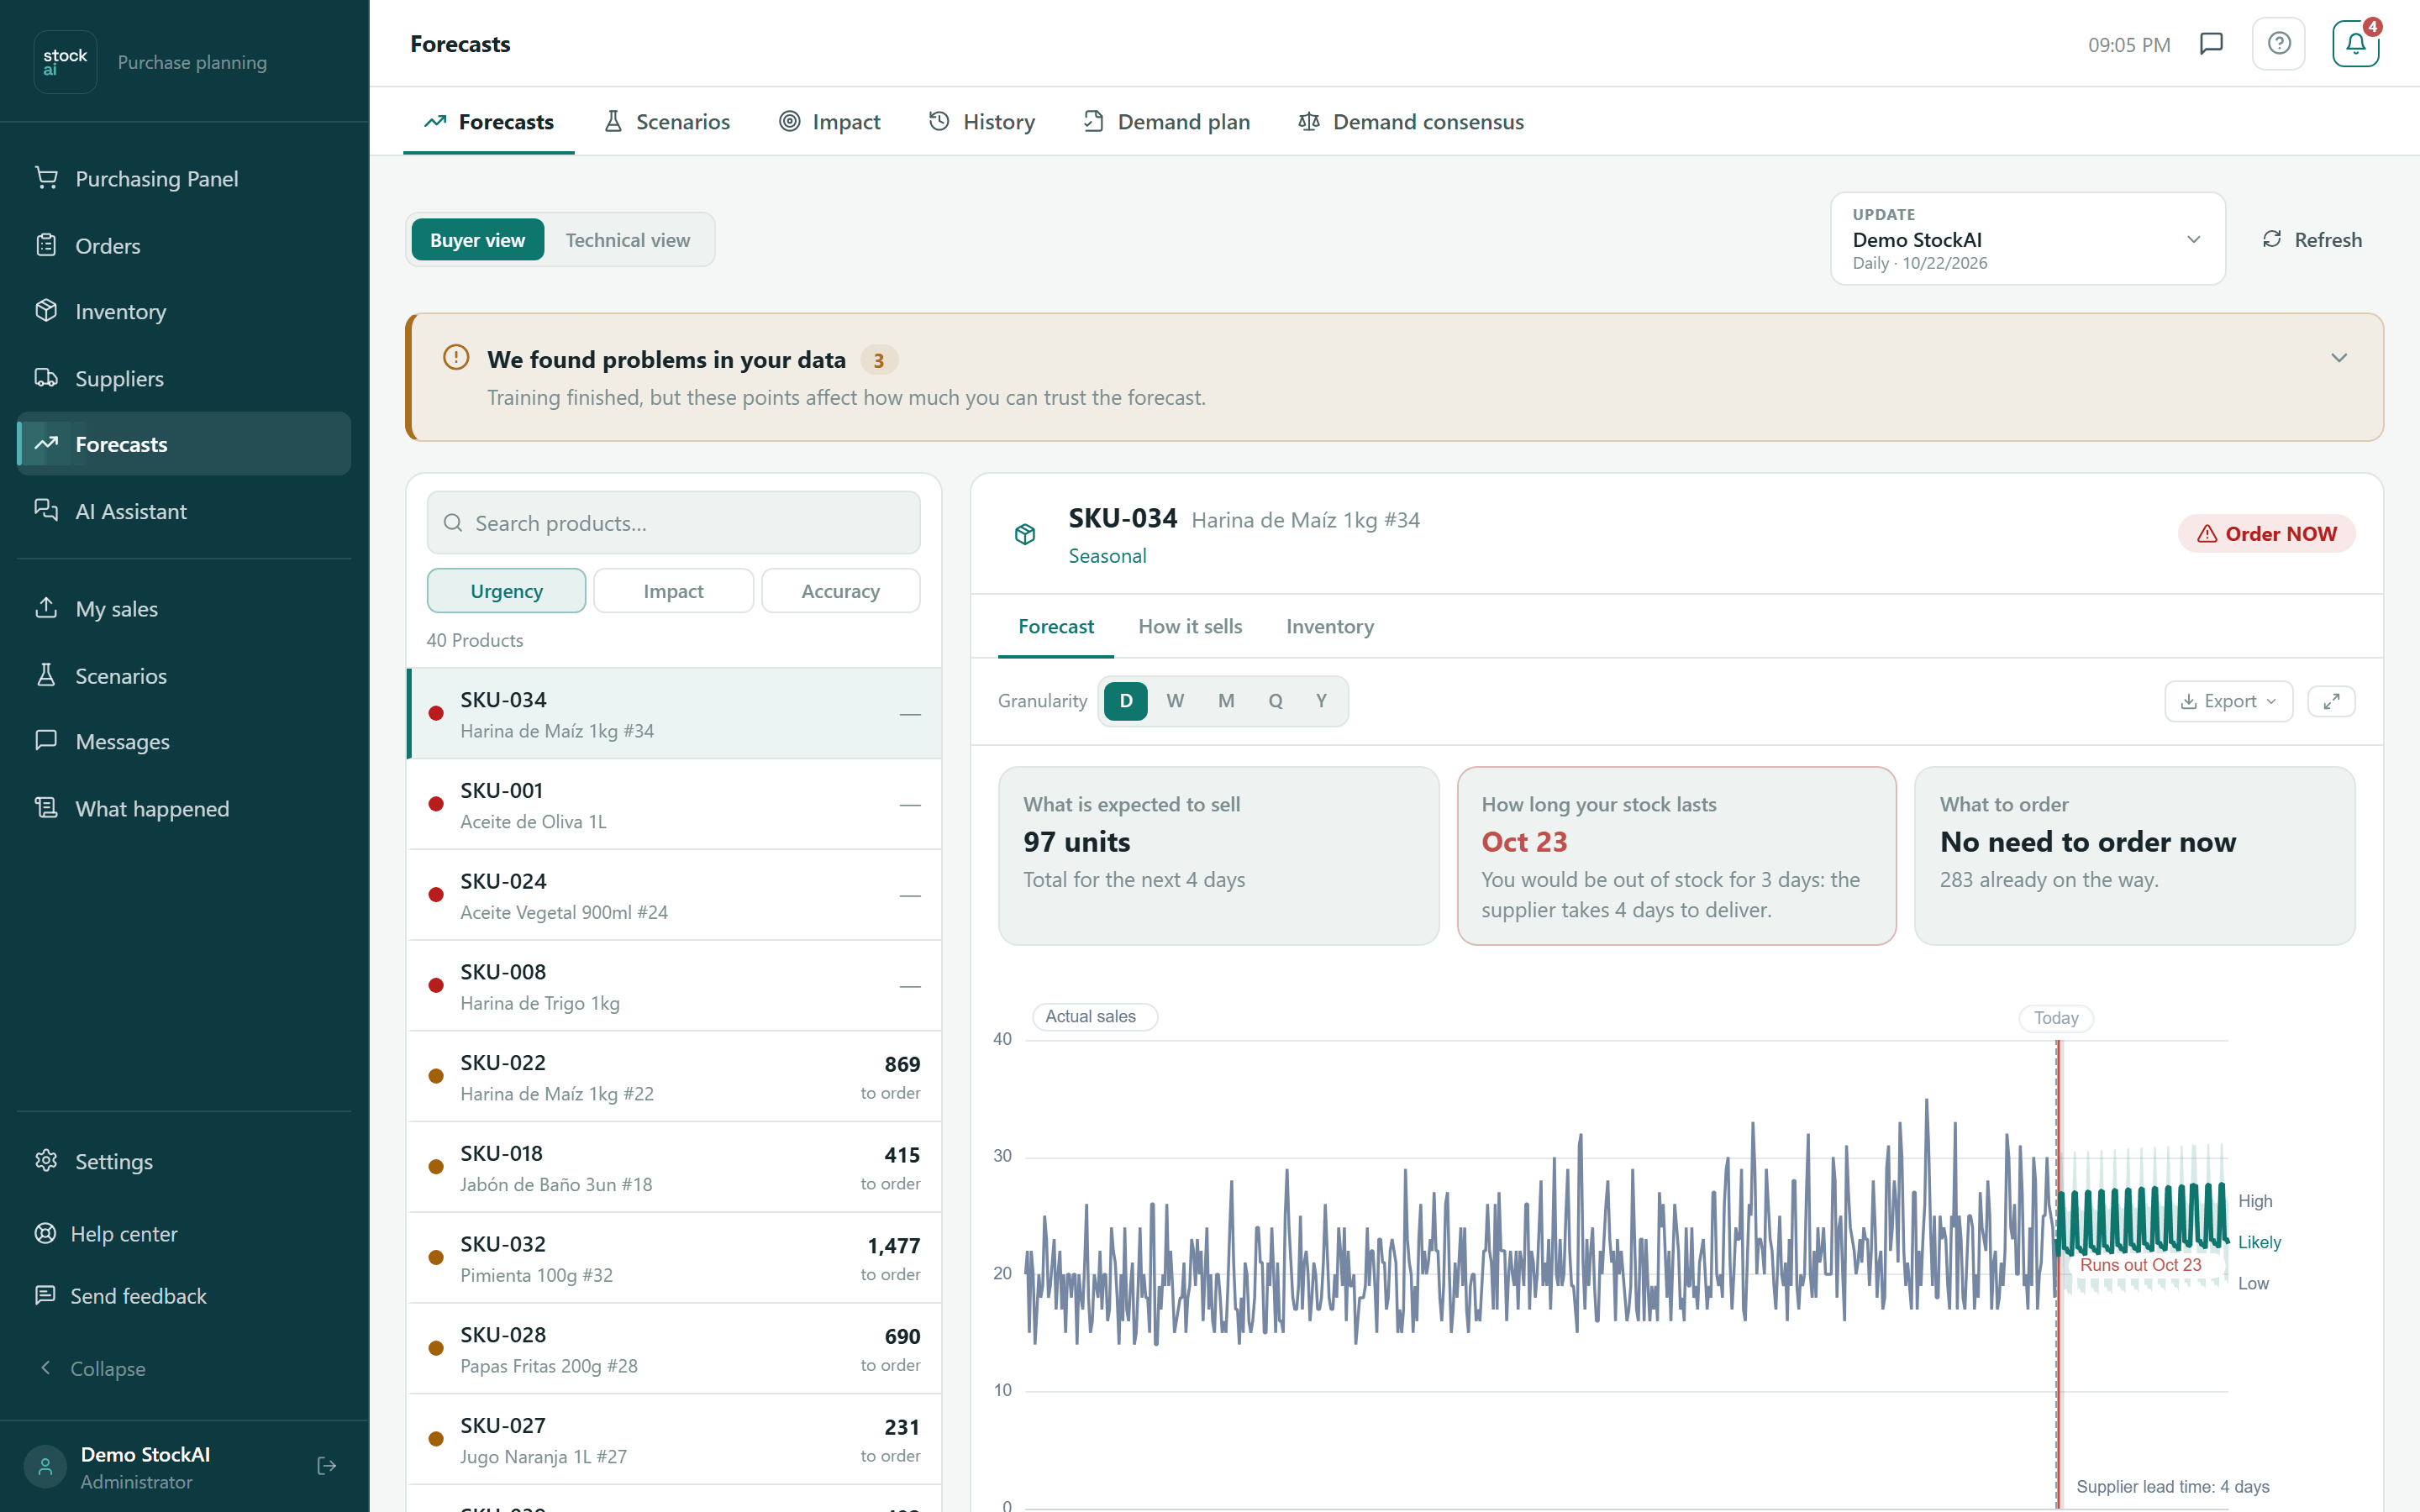
At the top of the product: its code and name, the series type (for example intermittent or stable) and the signal. If the engine found problems in its data (short history, missing dates, outliers), they show right here. Below, three answers:
- What is expected to sell
- Total units for the coming periods.
- How long your stock lasts
- The date it runs out, and whether you would be out of stock for some days because the supplier takes longer to deliver. With no stock loaded: “No stock data. Load it in Inventory to see when it runs out.”
- What to order
- “Order N units” or “No need to order now”, how much is already on the way, and the “Place the order” link to Inventory.
The chart shows Actual sales, the Today line, the Likely forecast with its Low–High range, the day stock runs out and the supplier lead time. Hover to read each value. Below it, the confidence (high, medium or low), “Usually within ±N units per period” and the average error.
Above the chart: Granularity (the D, W, M, Q and Y buttons: view by day, week, month, quarter or year), Export (see below) and Fullscreen.
The product’s tabs
The buyer view has Forecast, How it sells and Inventory; the technical one adds Metrics and Quality.
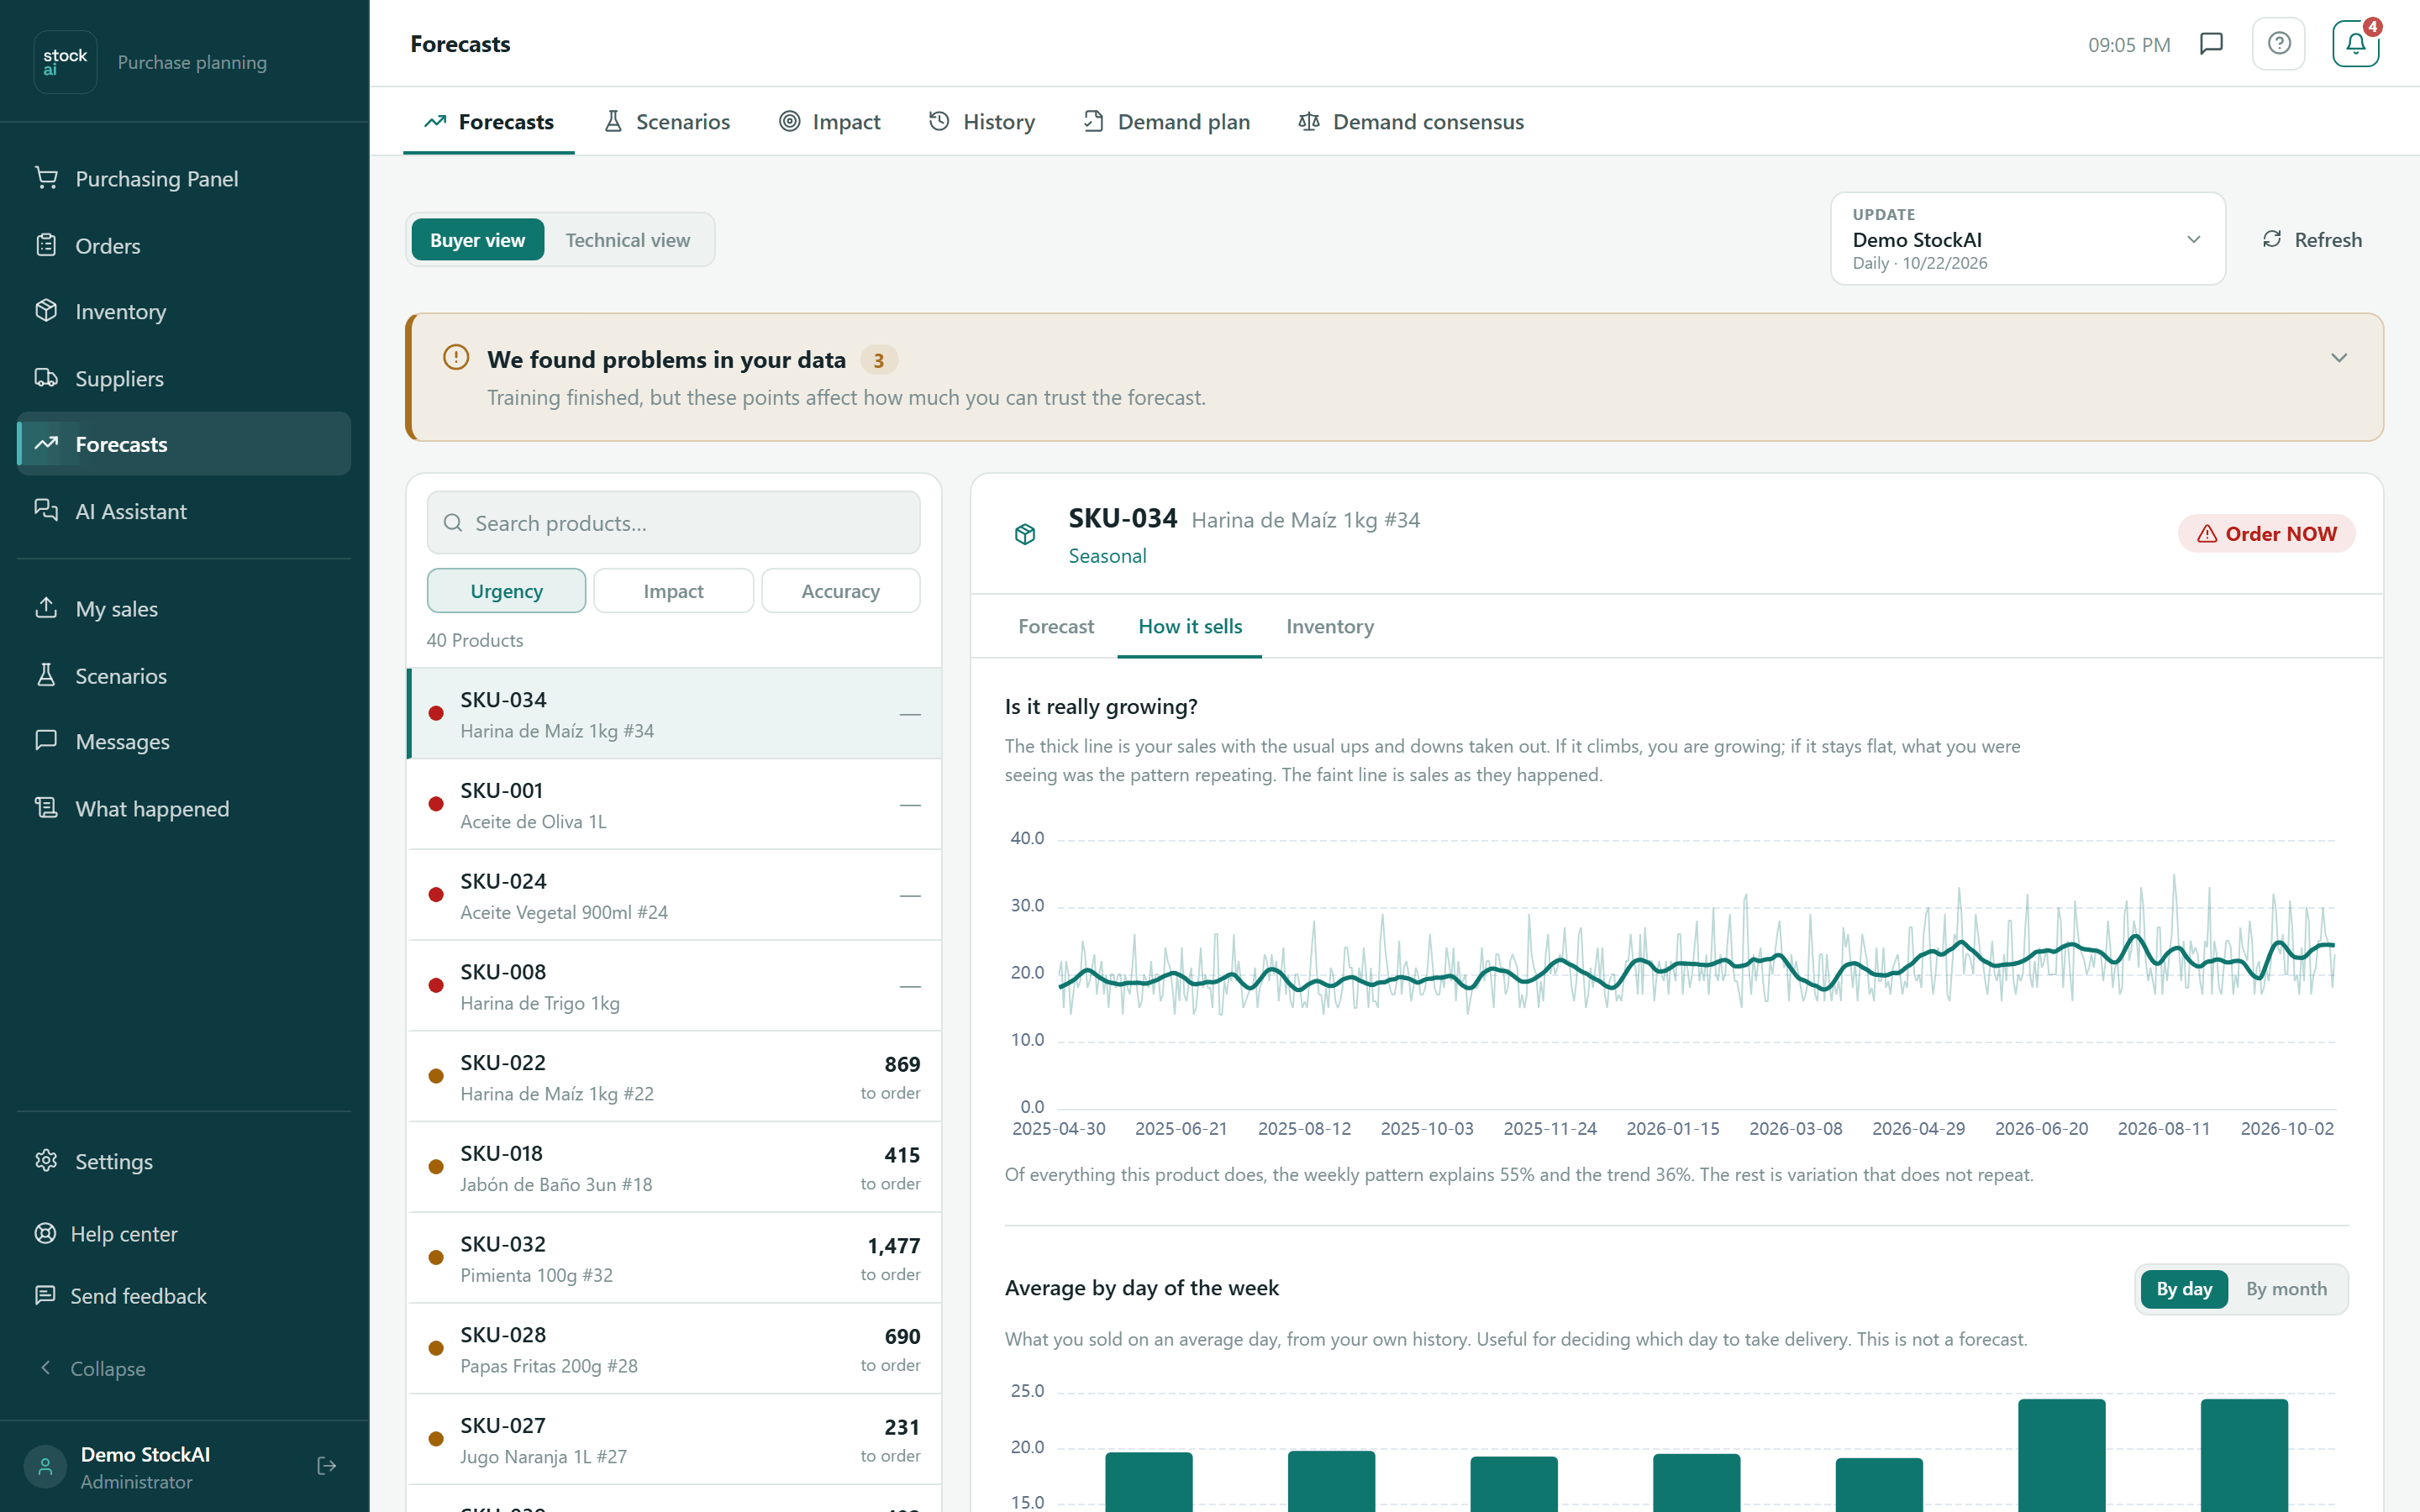
- How it sells
- Is it really growing? (sales without the usual ups and downs: if it rises, you are growing), Average by day of the week or Average by month (By day / By month buttons; useful to decide which day to receive goods, not a prediction) and How much you sell per period (how your sales break down; the right tail is the peaks your stock has to absorb).
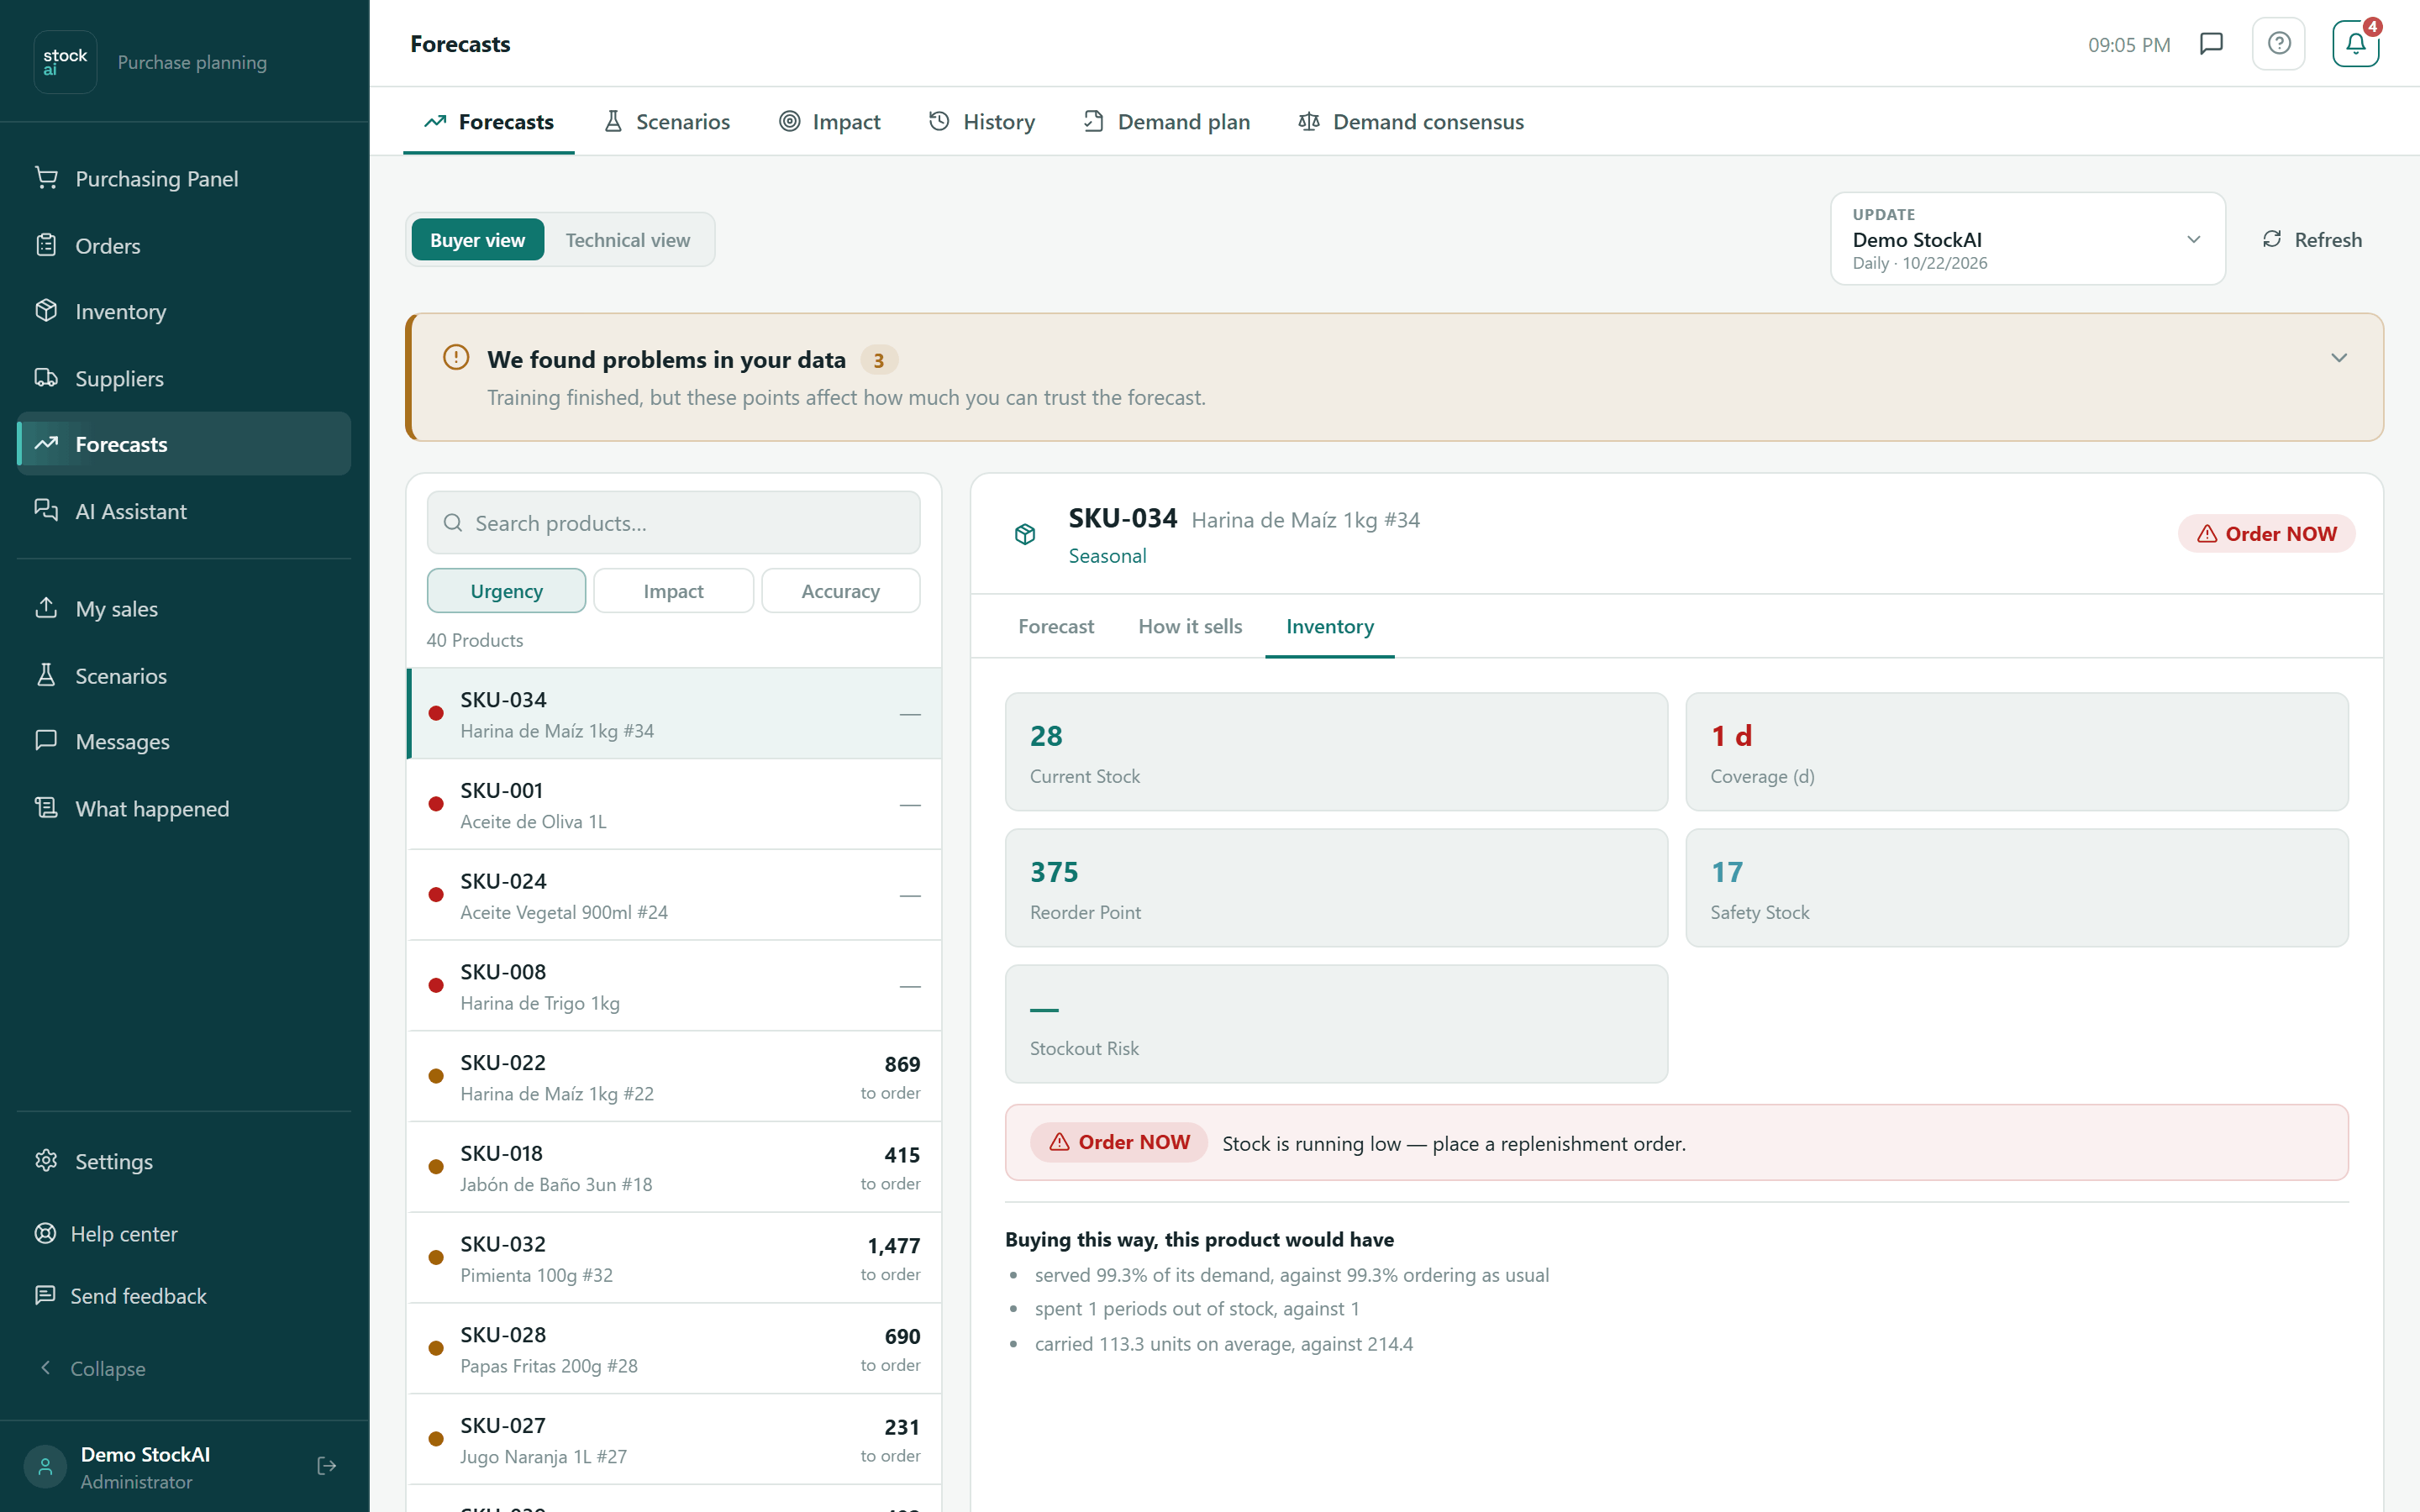
- Inventory
- The action message (order, order soon, overstock, all good or no data), Current stock, Coverage, Reorder point, Safety stock, Stockout risk and Holding cost. If the run computed it: “Buying this way, this product would have…” (demand served, periods out of stock and average inventory against ordering as usual) and where the safety cushion comes from.
- Metrics
- Technical view. Every model evaluated, with Type, MAE, RMSE, Average error, Bias, Folds and Cost (what getting it wrong would cost, counting that running out costs more than having spare: the column that picks the winner, tagged BEST). Shown as Table or Heatmap and exported to CSV or Excel.
- Quality
- Technical view. Quality score, Records, Outliers, Missing data and the series’ warnings; View expands the detailed statistical analysis.
Exclude a one-off period
Under the chart is “Excluded one-off periods”. It keeps a one-off order or a promotion that will not repeat from inflating the forecast.
- Click “Exclude a period” (or “Exclude {date}” next to a detected outlier).
- Pick From, To and the Reason: One-off order, Promotion that will not repeat, Catch-up after a stockout, Data error, External event or Other (with a required Detail).
- Click “Exclude from the baseline”. The line is recorded with who and why; Undo removes it.
The likely range
The "Likely range" button turns the uncertainty cloud around the forecast on and off. It is drawn as three nested rings:
| Ring | What it covers |
|---|---|
| Wide range | The 5th to the 95th percentile of what could sell. |
| Likely range | The 10th to the 90th percentile. This is the one in the legend. |
| Middle zone | The 25th to the 75th percentile. |
The range is not a textbook formula: it comes from the real errors the forecast made when we tested it on your own history. It is the same range the safety stock is computed from.
Accuracy and Reliability are not the same
- Accuracy
- How close the chosen model came when we tested it on data it did not see in training: one minus its error (WAPE), as a percentage.
- Reliability
- High, Medium or Low: how solid the data behind the forecast is. A short or irregular history lowers reliability even when test accuracy is good.
- Sales range
- The minimum and maximum you actually sold. Not a prediction: your history.
Read them together. High accuracy with low reliability means the model did well in a few tests on little history.
How it sells
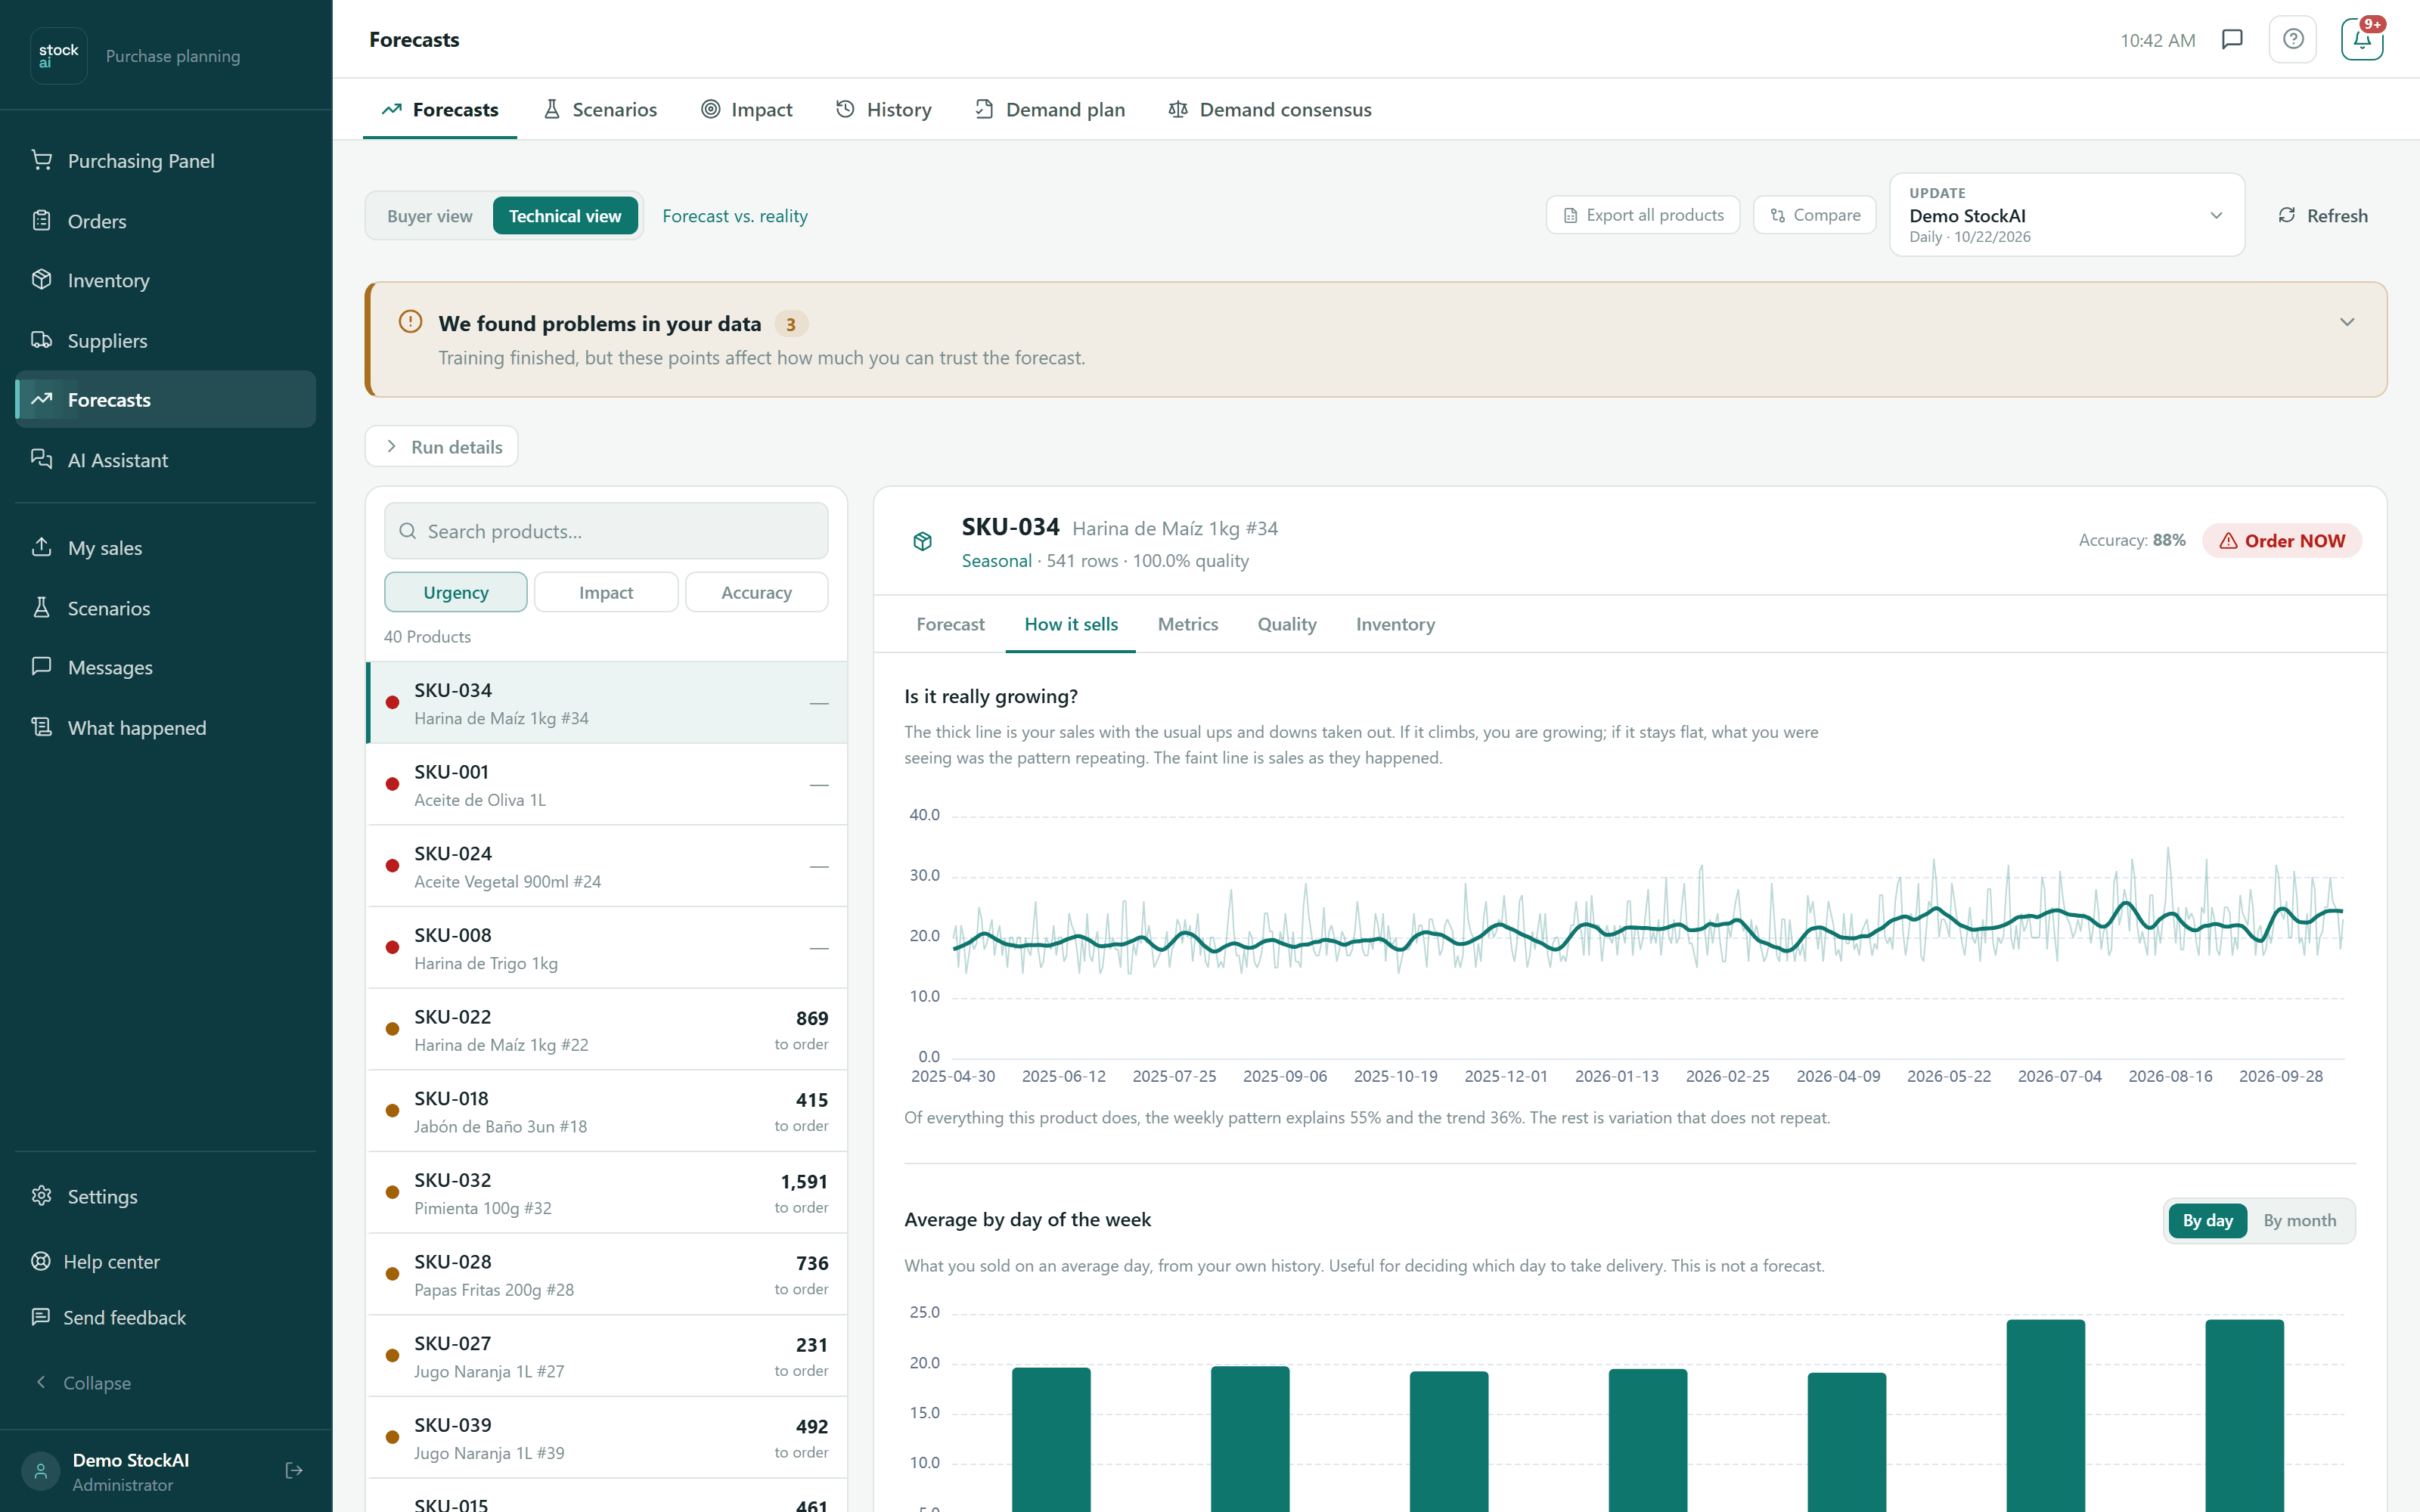
This tab looks at your history only; no model is involved. It answers three questions:
- "Is it really growing?": two lines, sales as they are and the same sales with the usual ups and downs removed. If the thick one rises, the growth is real.
- By weekday or by month: the average sold each Monday, each Tuesday… or each month. It needs at least 8 weeks of history for weekdays and 12 months for months.
- How much you sell per period: how often you landed in each sales range. The right tail is the peaks your stock has to absorb.
The Inventory tab
It shows the product's stock position and, at the bottom, "What buying this way would have done": it replays your way of buying over sales that already happened and compares it with ordering the same as last time.
Technical view
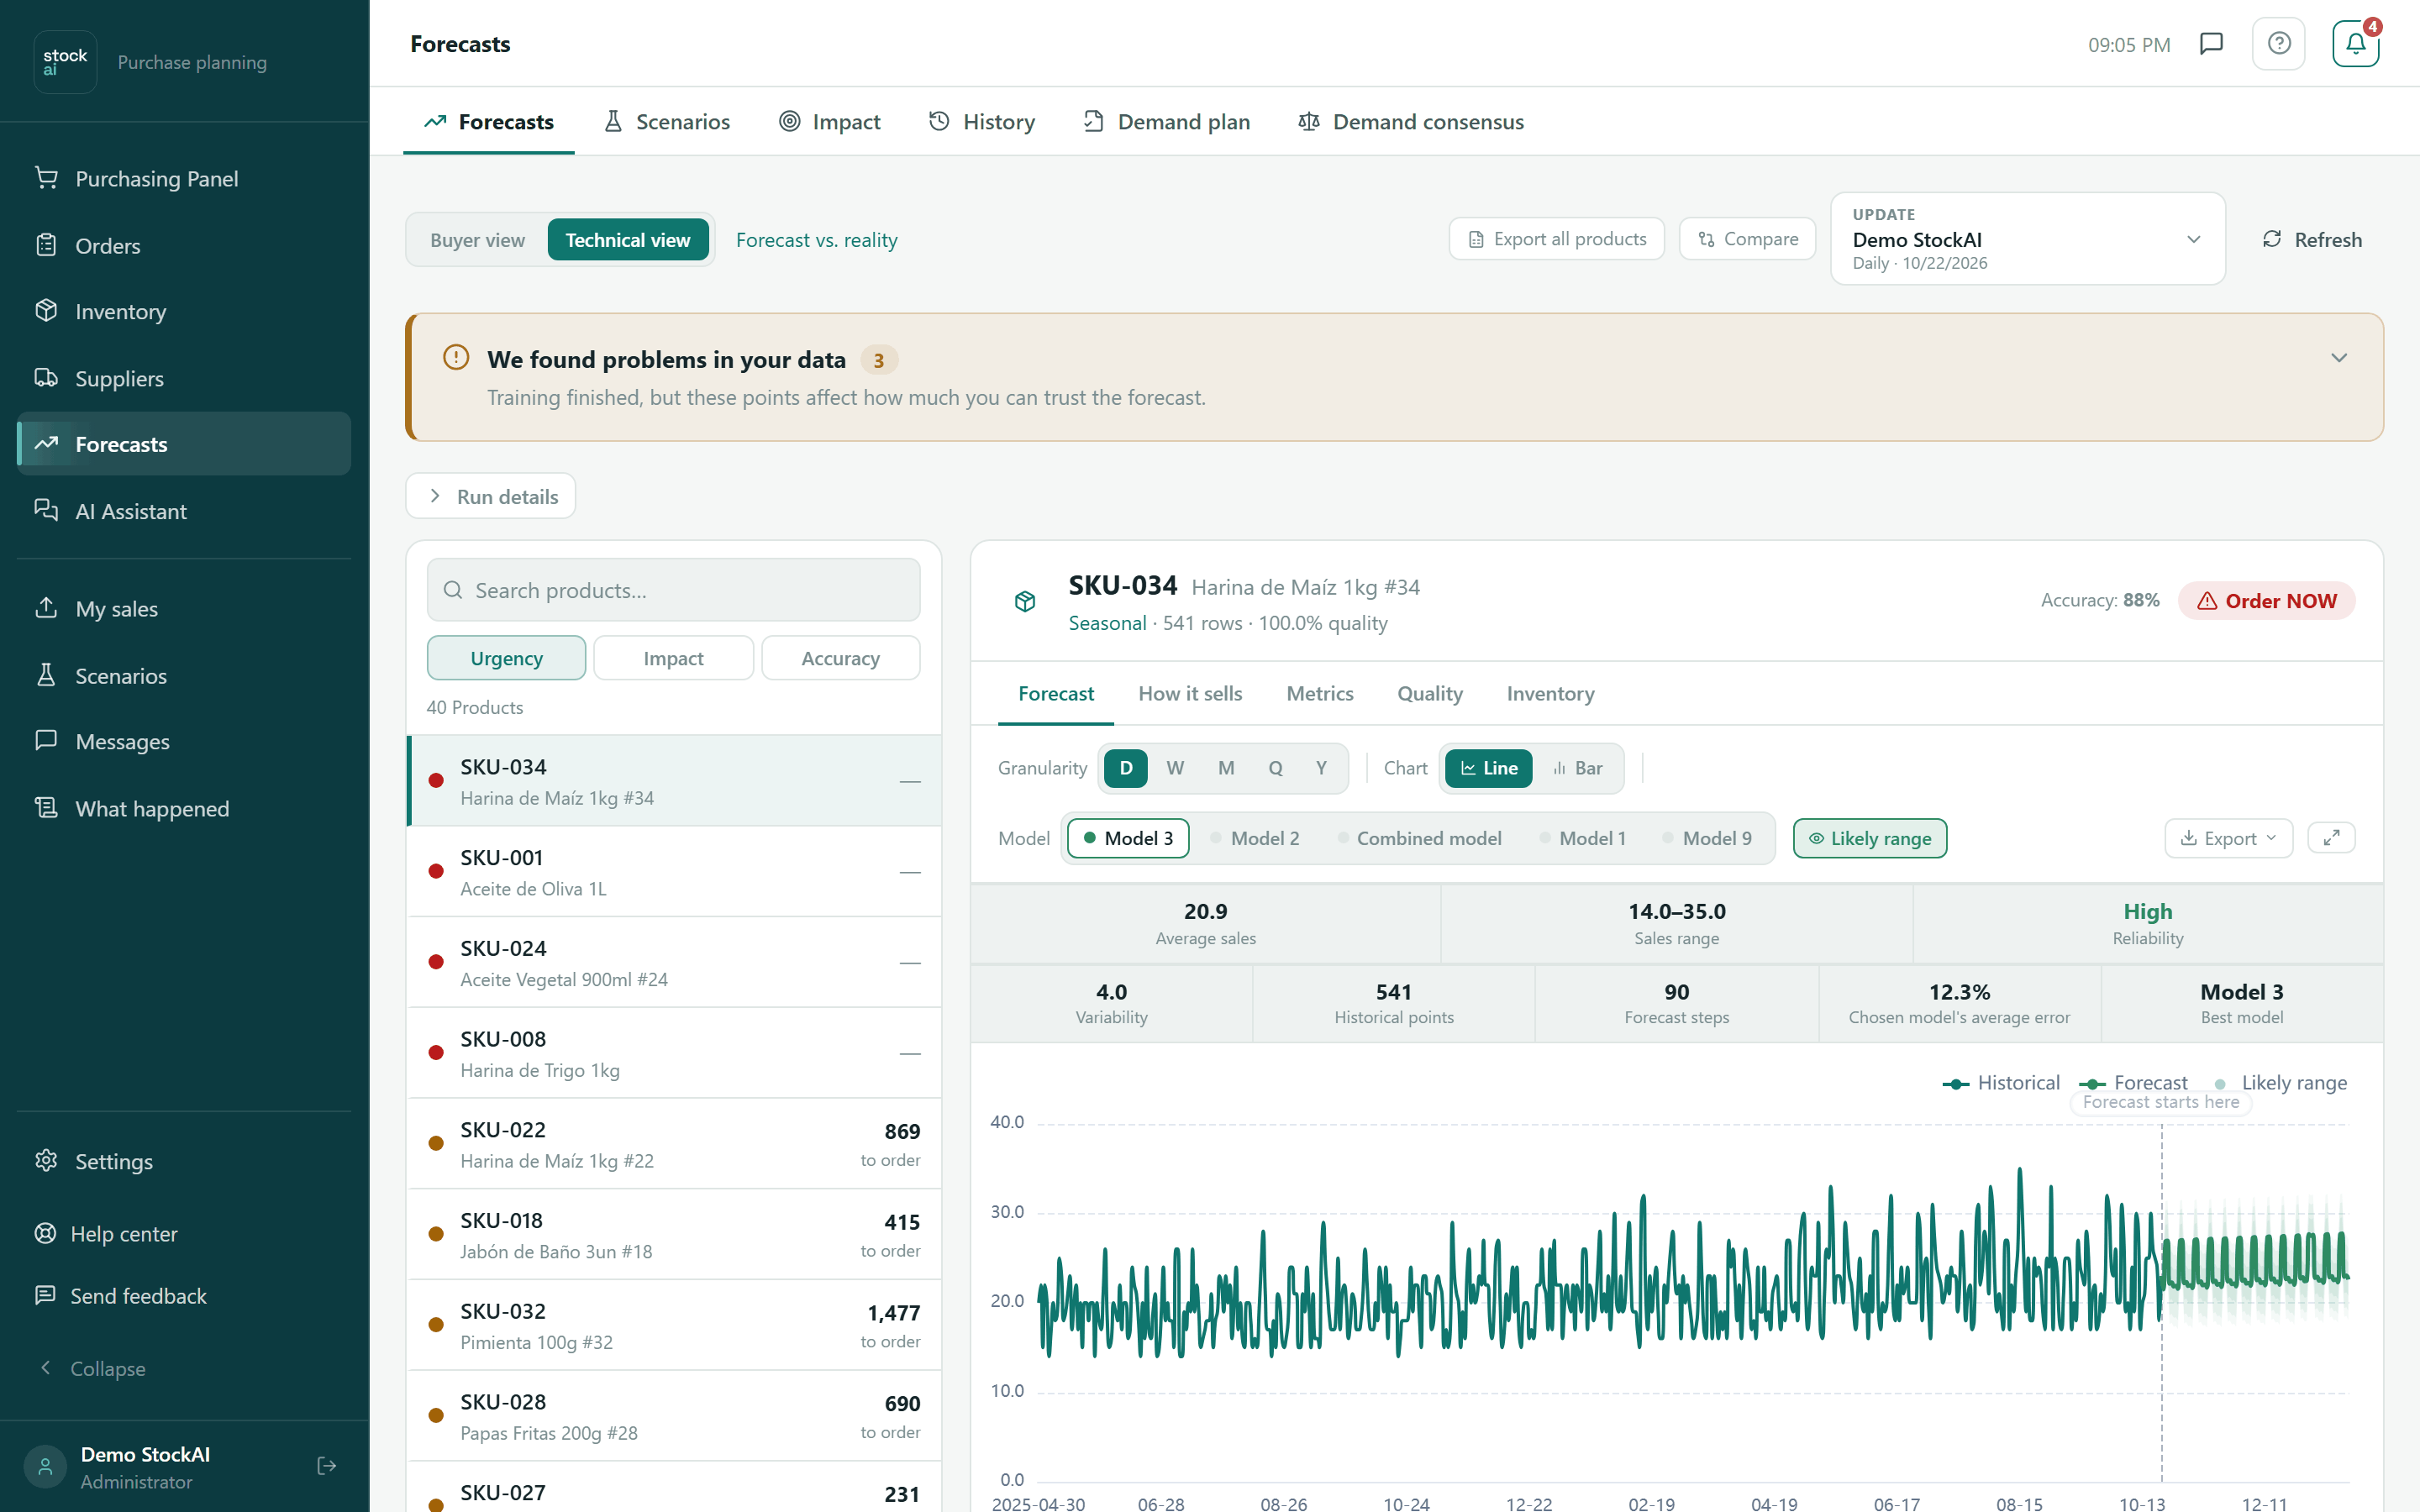
- In the header, the Accuracy of the model the chart is drawn from, and next to the series type, its records and quality score.
- Run details: a disclosure with how the forecast was produced and what the ordering policy would have done.
- Above the chart: Chart (Line or Bar), Model (see another model’s curve) and Likely range (show or hide the band).
- Two rows of figures: Average sales, Sales range and Reliability; Variability, Historical points, Forecast steps, Chosen model’s average error and Best model.
- At the bottom: original frequency, applied view, history and forecast points, model, and how many gaps and outliers were detected.
The Metrics tab (technical view)
It lists every model that ran on that product, sorted by Cost: what being wrong with each would cost, counting a shortage as three times as expensive as a surplus. The first one carries the "BEST" tag, which is why the winner may not be the one with the lowest WAPE. See How the models compete.
Models are shown as "Model 1", "Model 2"… and the numbering is the same across the app. The references — "Reference (last value)", "Reference (season)" and "Reference (average)" — are the bar to beat and never win.
Export
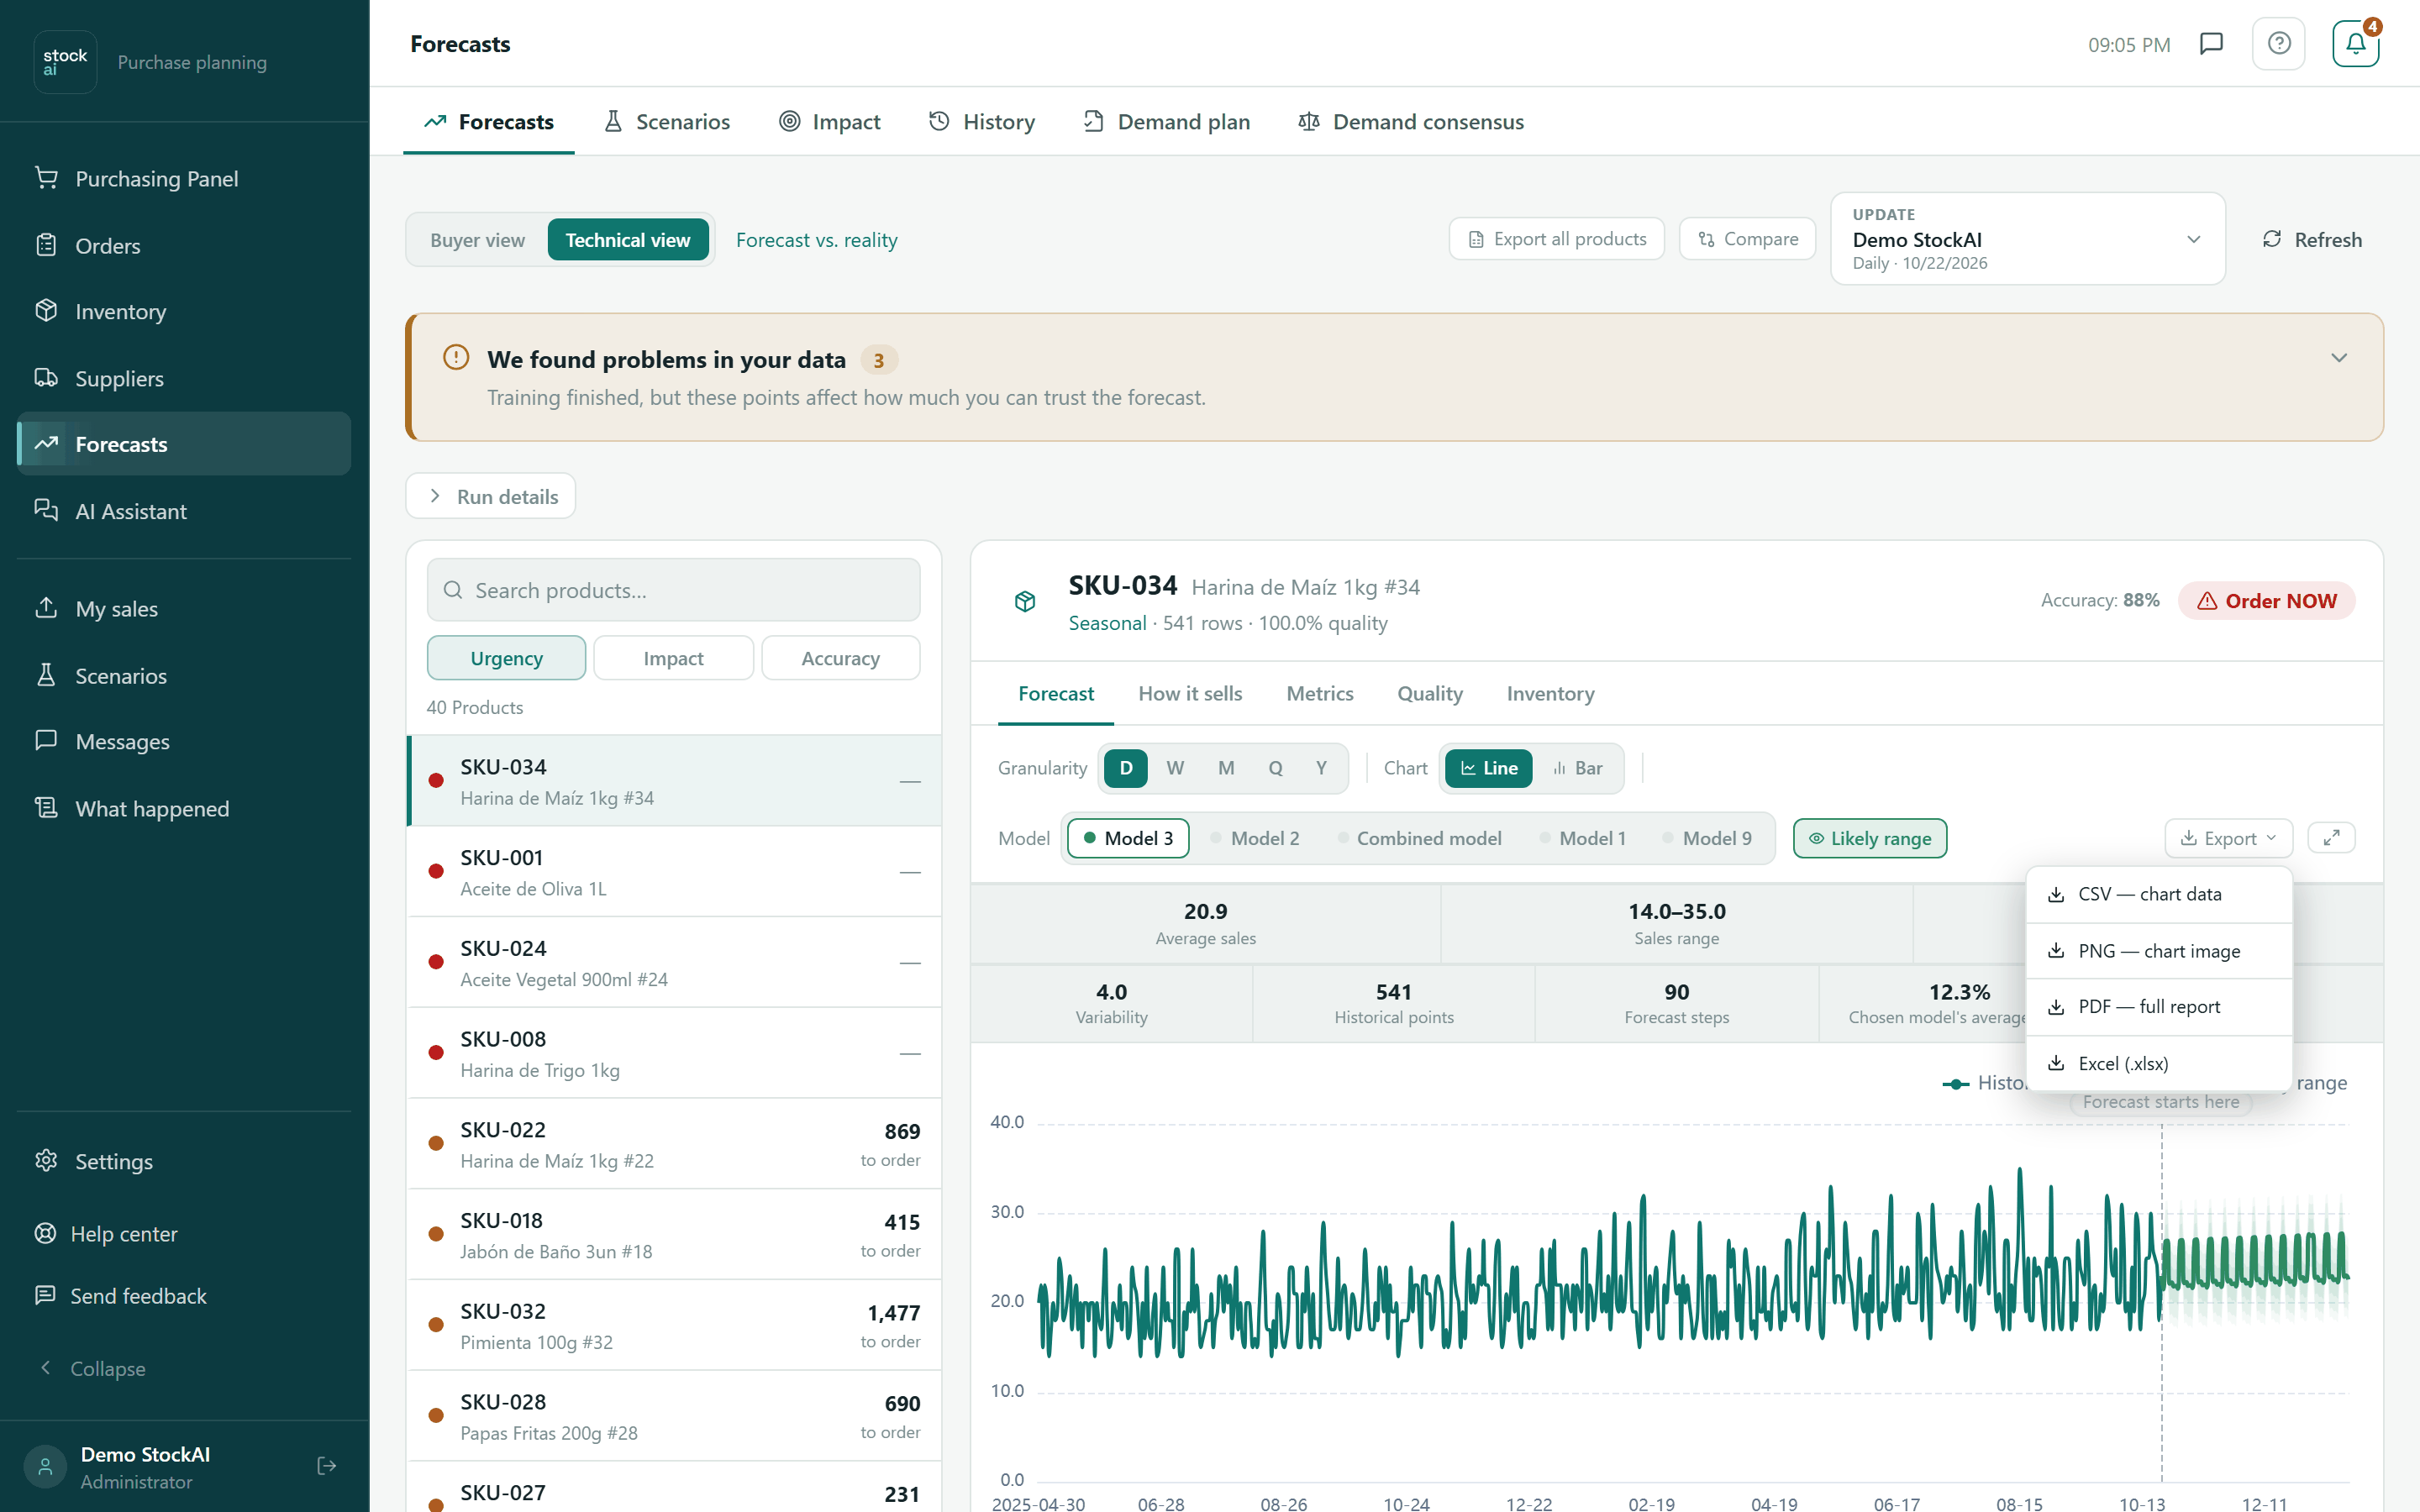
- CSV — chart data
- The dates with sales and forecast.
- PNG — chart image
- The image as you see it.
- PDF — full report
- Chart, statistics and model performance.
- Excel (.xlsx)
- Summary, forecast and metrics sheets.
Compare runs
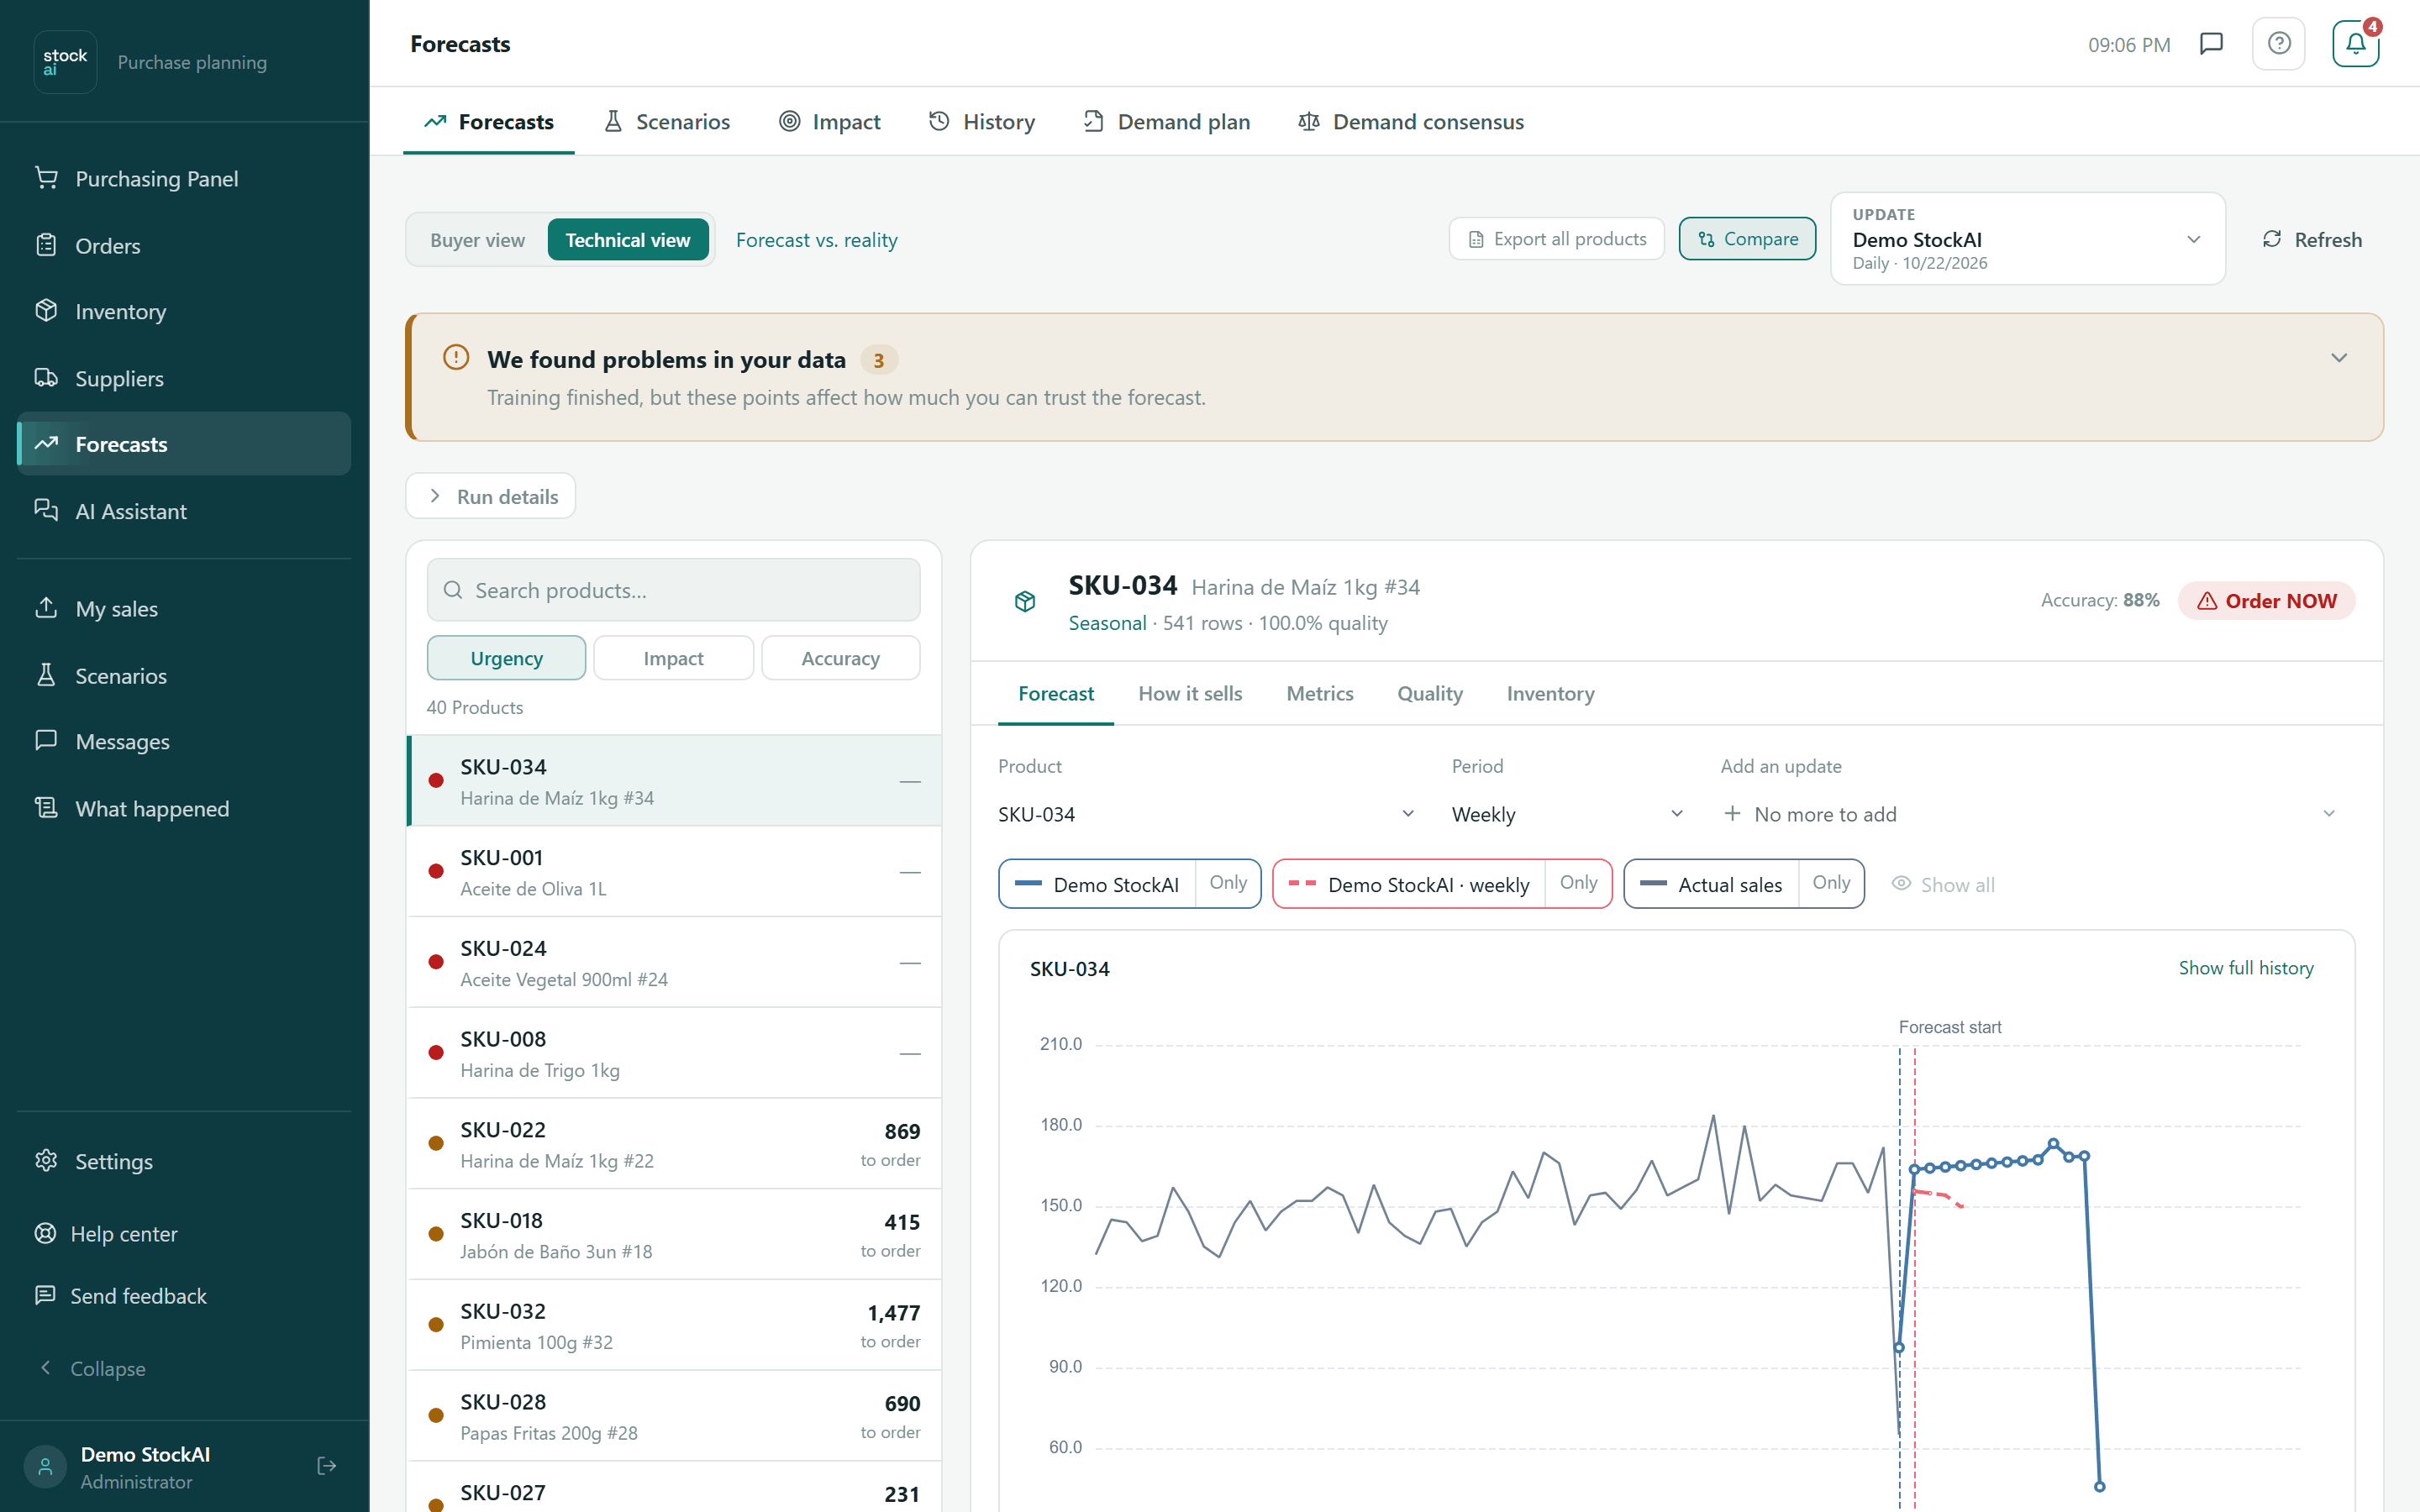
- Switch to the Technical view and click “Compare”.
- In “Add an update” pick another run (up to 6 at a time, including “the one you are viewing”).
- Choose the Product or “All products (total)” and the Period.
- Read the chart (with Actual sales) and the table with Update, Model, Horizon and Accuracy. Only keeps one series, Show all brings them back; Show full history / Focus on the forecast change the range.
- Click “Compare” again to leave.
When there are no forecasts
With no runs, the list says “There are no products to analyse yet” with “Upload sales history”, which leads to My sales. If part of the results fails to load, a notice names what is missing and offers a retry.
More context: How the models compete, Granularity and Stock signals.