Inventory
The stock signal screen: what to order, how much stock you hold and what it is worth, per product and per warehouse. From here you edit stock, log stock-outs, move goods between warehouses and open the money analyses.
On this page
- The top bar
- The three tabs and the Analysis menu
- The summary cards and the filters
- The full table (All products)
- A row's breakdown
- Editing a product by hand
- Update stock (the quick editor)
- Importing stock from a CSV
- Logging a stock-out (shrinkage)
- Warehouses: the selector and its setup
- One warehouse's view
- Transfers between warehouses
- Transfer suggestions
- Purchase orders with a destination
- The Analysis views
- Money not moving
- Rising costs
- Shrinking margin
- Forecast in money
- Cost of ignoring
- Committed demand
- Events and seasons
- What each status means
- When the screen is empty
Inventory puts the sales forecast next to your current stock and gives each product a colour: Order NOW, Order soon, OK, Overstock or No data. It is also where you keep stock up to date: by hand, from a file, per warehouse or with a physical count.
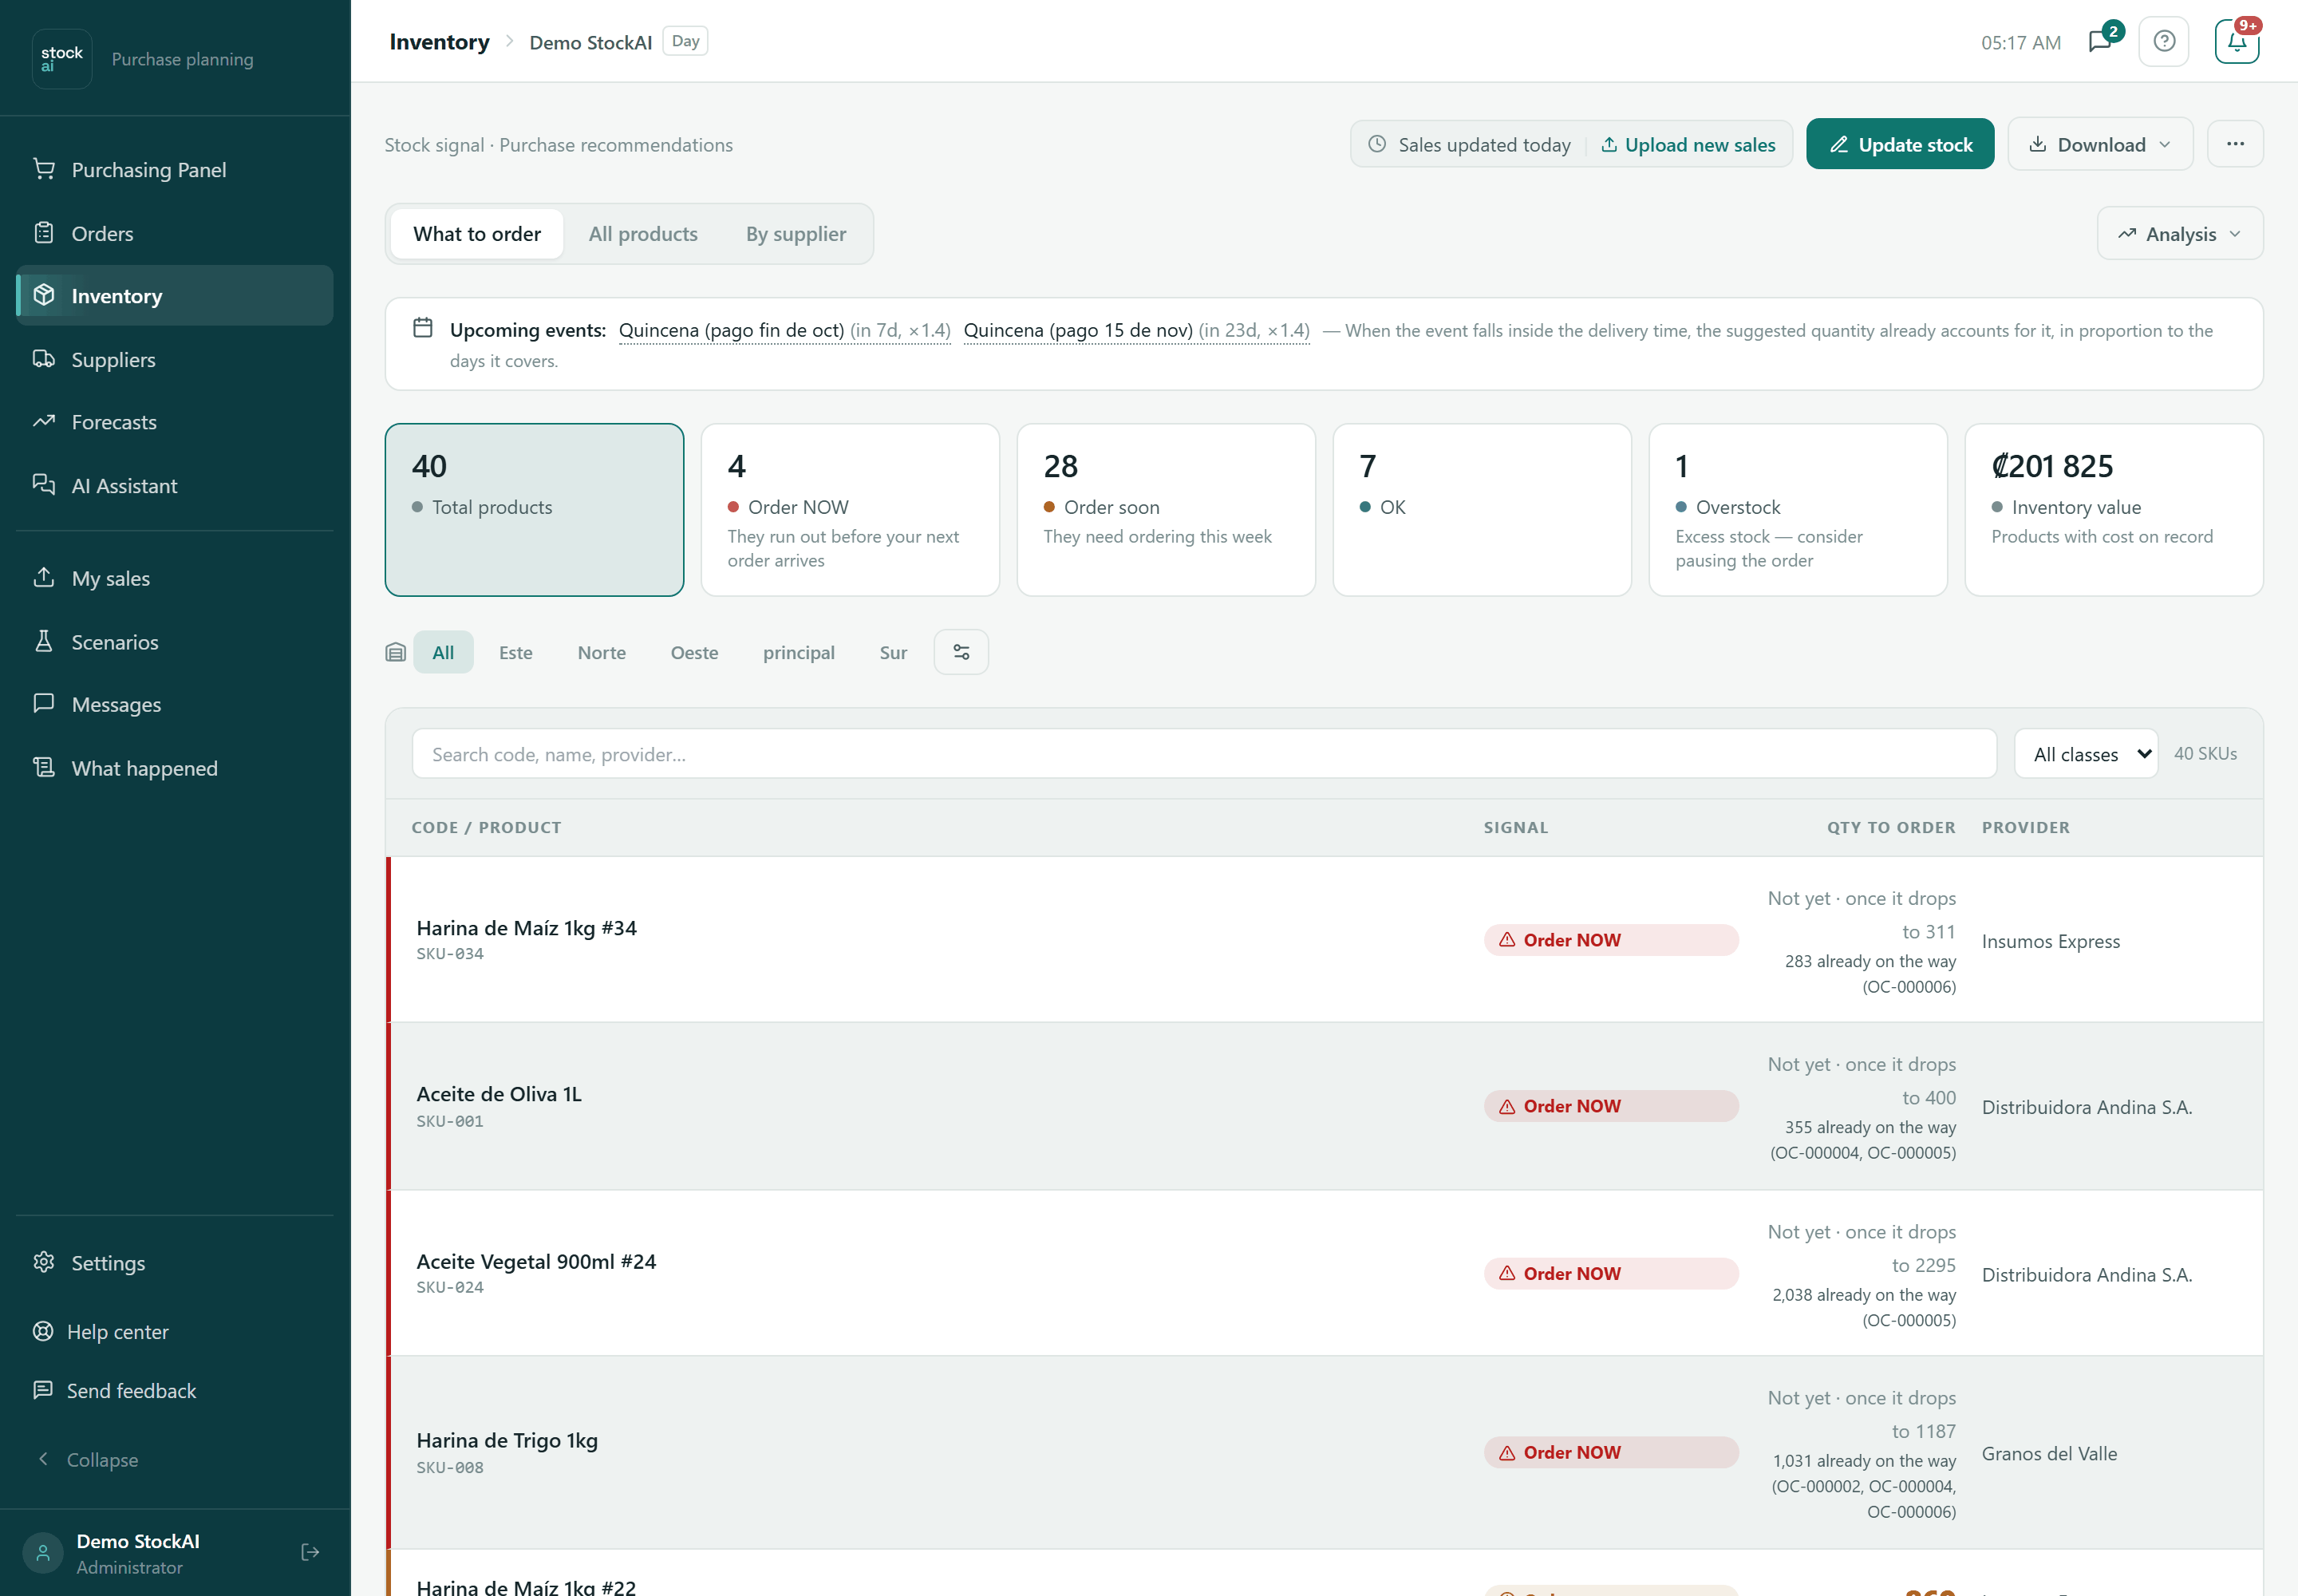
The top bar
On the left, on desktop, the line “Stock signal · Purchase recommendations”. On the right, from left to right:
- Sales updated / No sales data yet
- When the sales everything is computed from were loaded. “Upload new sales” takes you to My sales. If the sales are more than two weeks old, the warning says so.
- Update stock
- Main button (analyst or administrator only). Opens the quick stock editor: see Update stock.
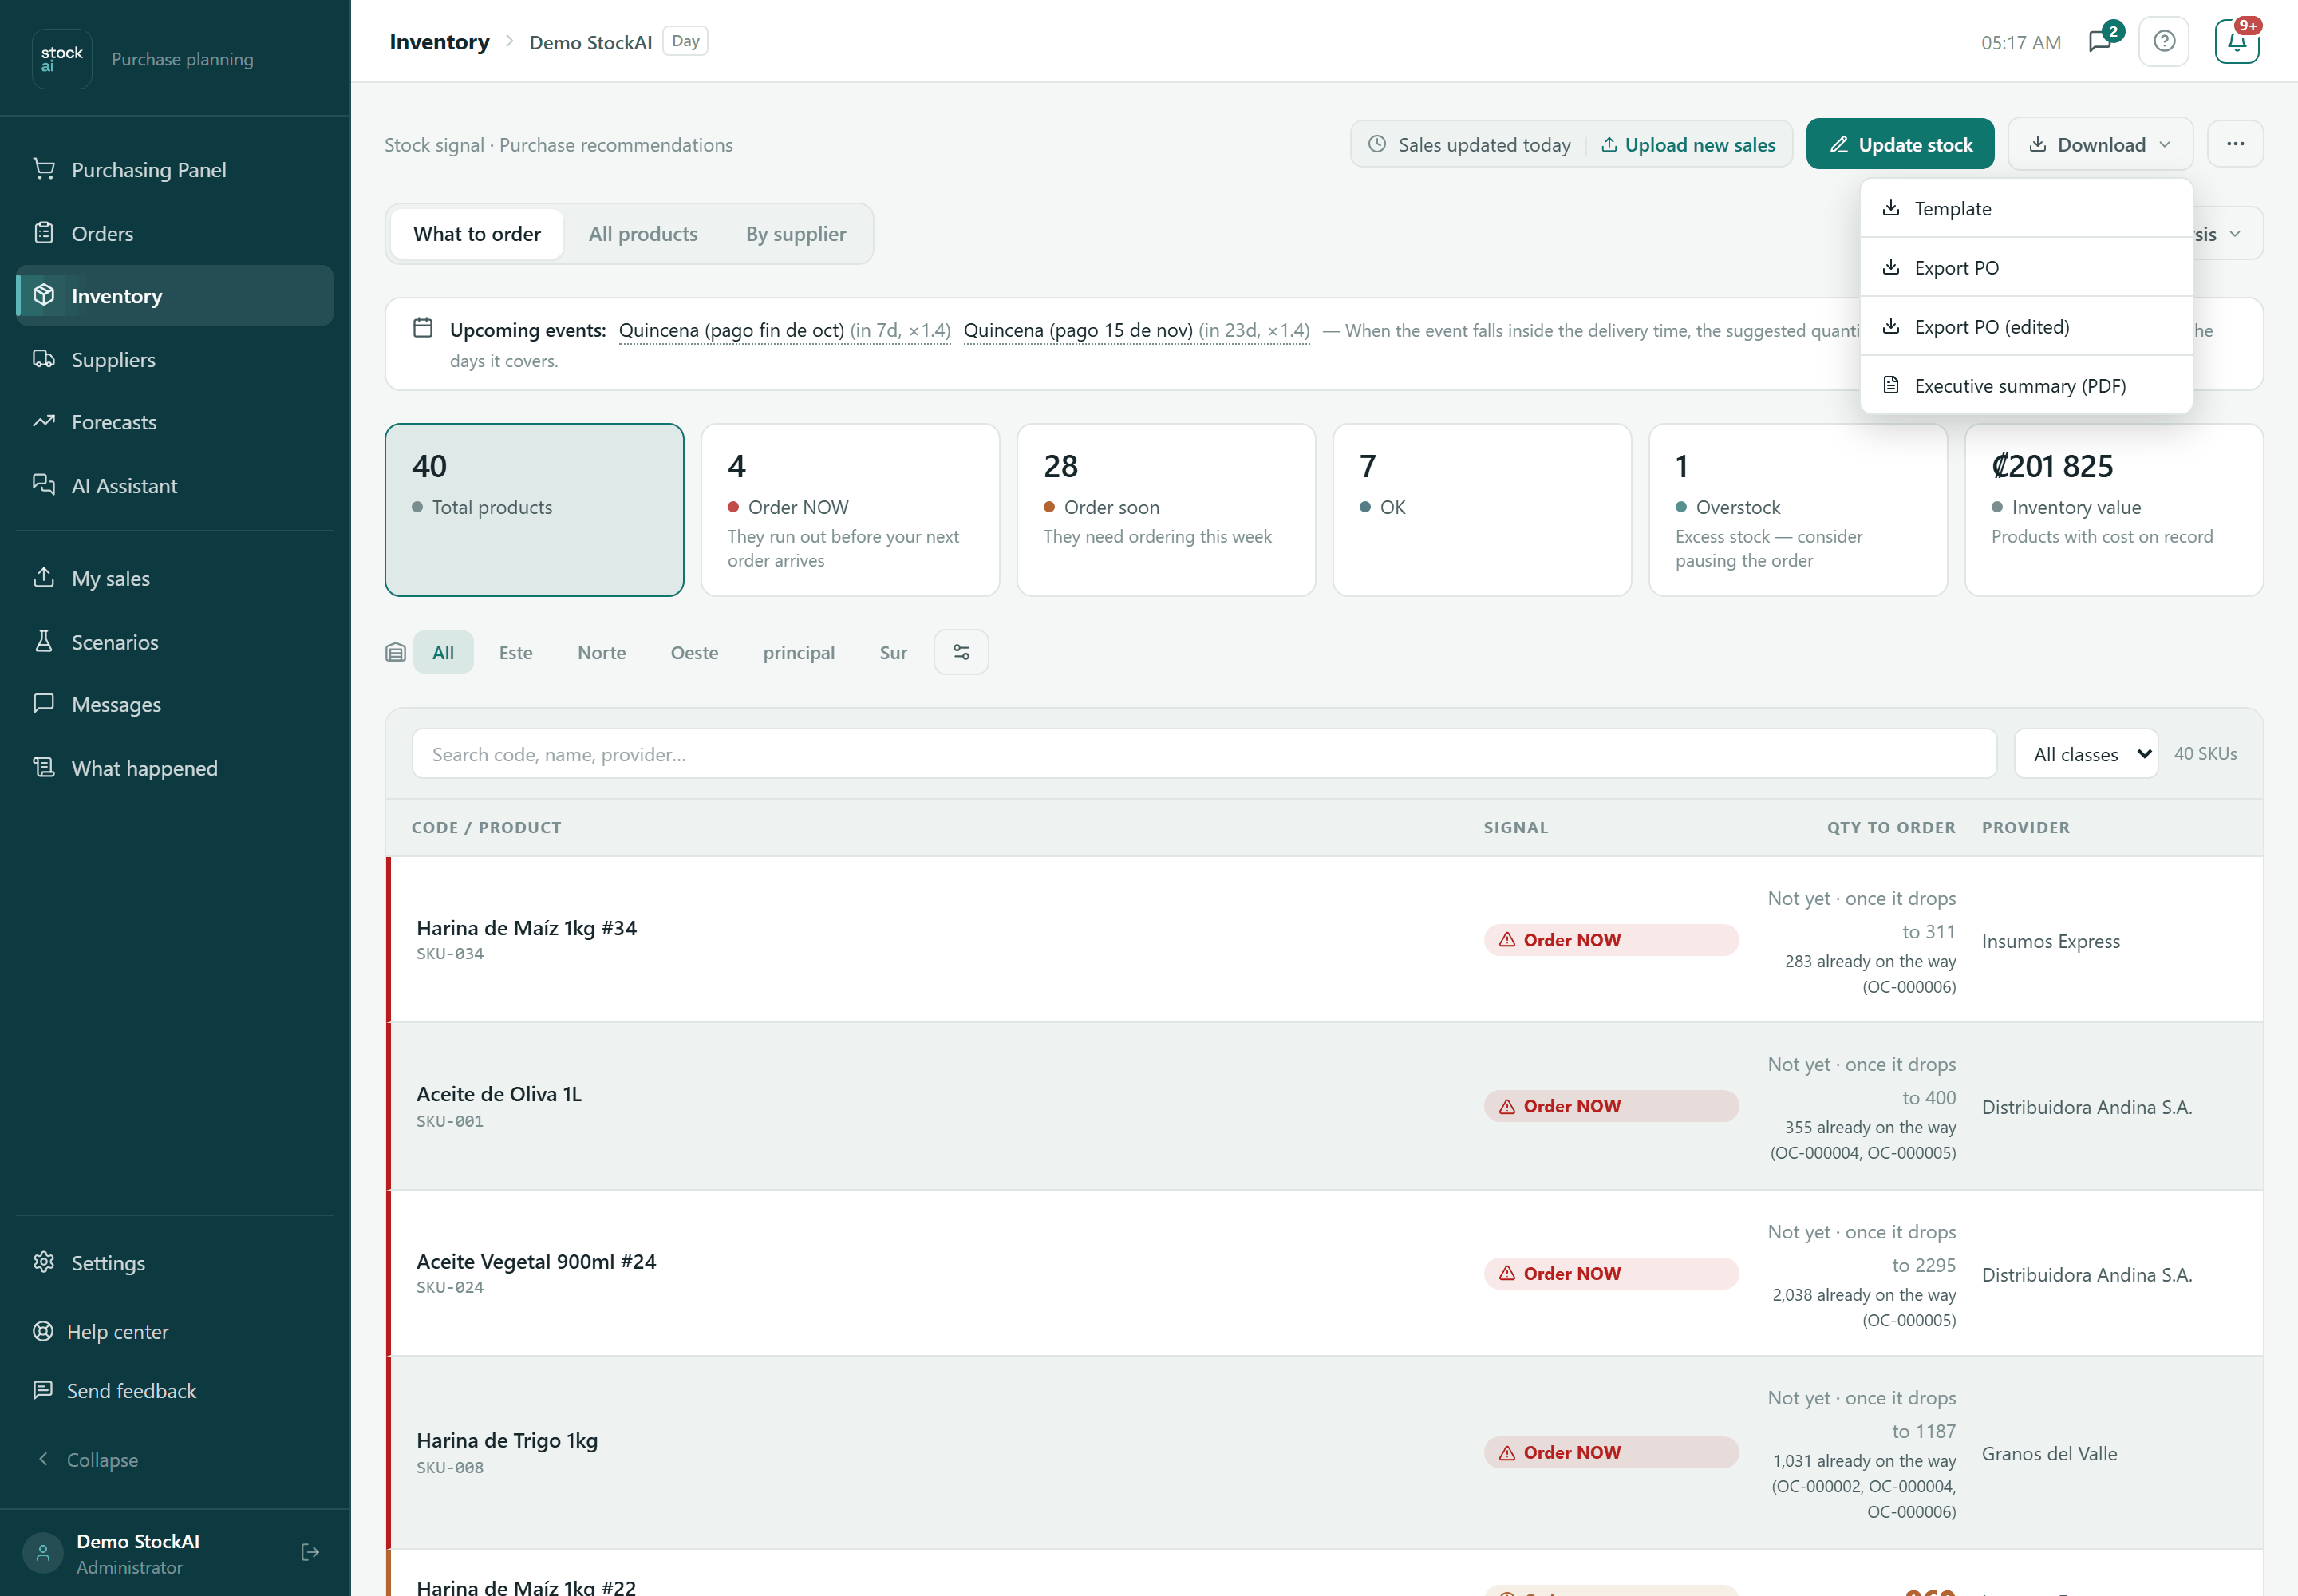
- Download
- Menu with four options: Template (the empty CSV with the columns we recognise), Export PO (the purchase order the server works out), Export PO (edited) (the order with the quantities you changed by hand) and Executive summary (PDF). The last three need a finished forecast.
- Data as of … / Refresh now
- Only shown when you have an inventory sync. It says how current the stock is (green up to date, amber out of date, red stopped) and lets you ask your system for an immediate refresh. While it runs, the table keeps showing the last good data.
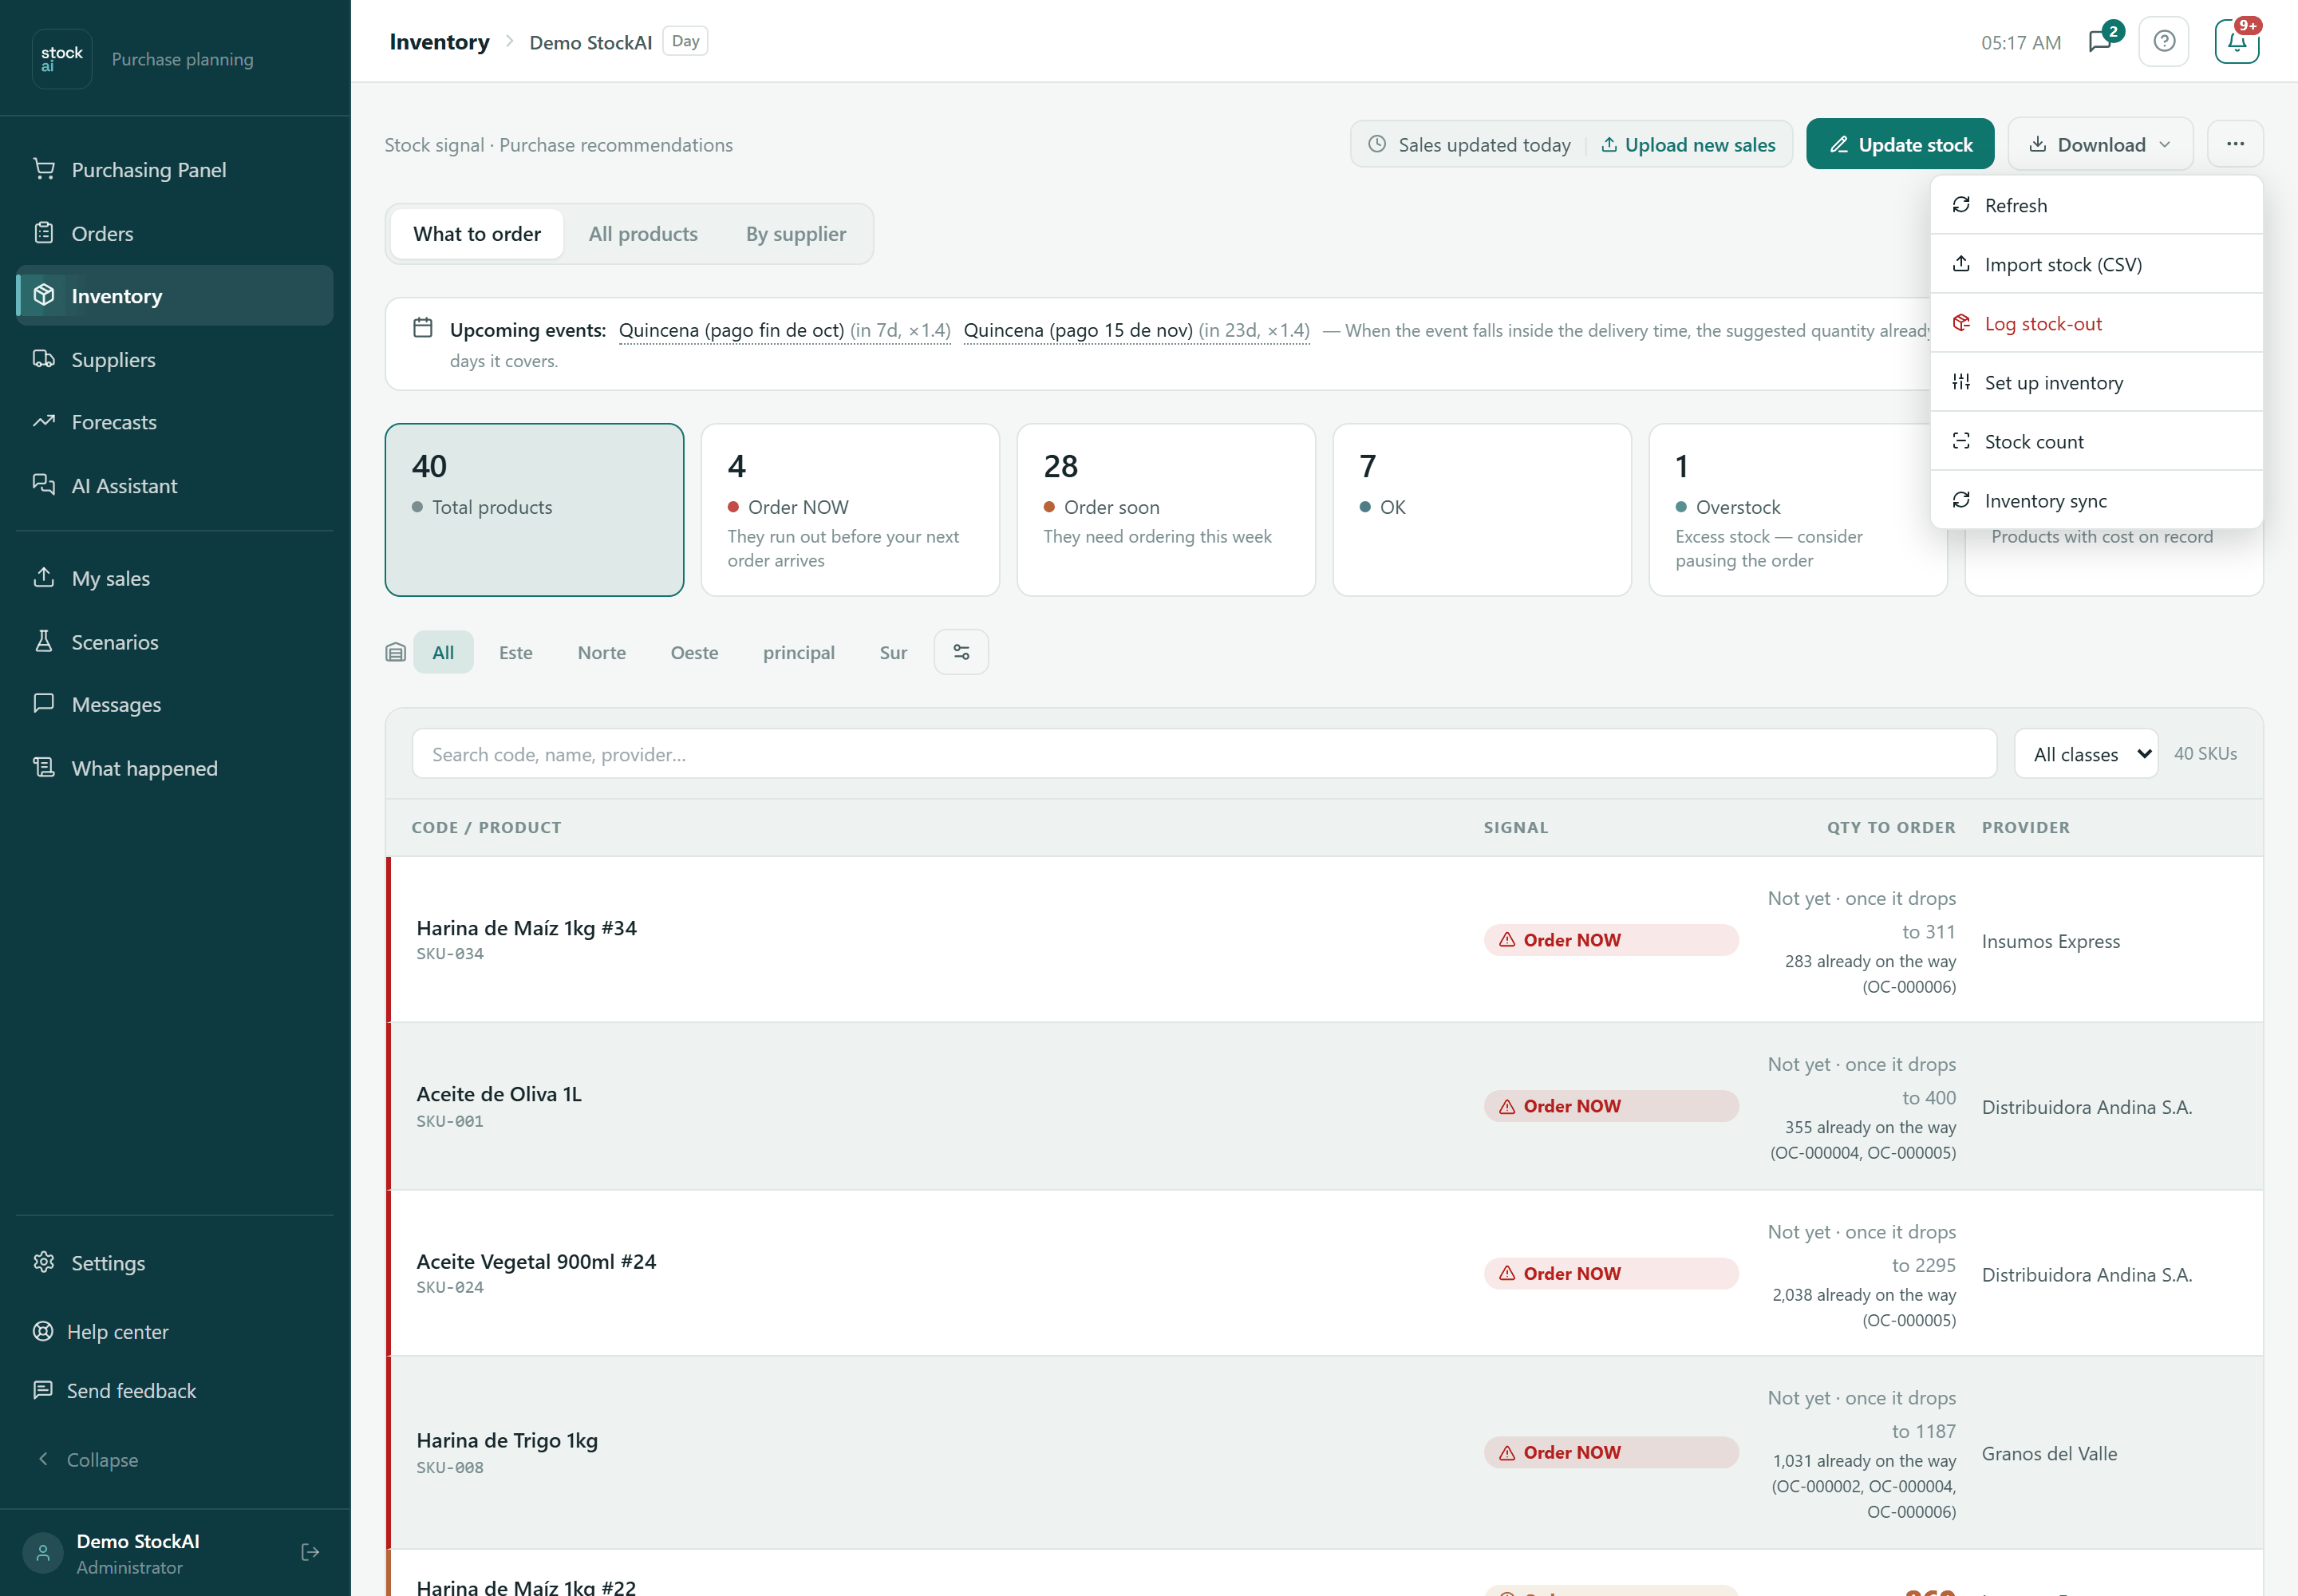
- … (More actions)
- Refresh (reloads the screen), Import stock (CSV) and Log stock-out (analyst or administrator), Set up inventory (opens Set up inventory), Stock count and Inventory sync (analyst or administrator).
The three tabs and the Analysis menu
Below the bar you choose how to look at your stock. The three tabs use the same data; the order and the columns change.
- What to order
- The simple view. Four columns: Code / Product, Signal, Qty to order and Provider. Products that need a decision come first (Order NOW and Order soon, with a coloured edge on the left). When part of what is needed is already on its way, the quantity says how much and from where.
- All products
- The full table, sortable by column: see The full table.
- By supplier
- The same products grouped by supplier, with each one's quantity to order, to put together an order per supplier. With several pages, each group shows only the products on the current page.
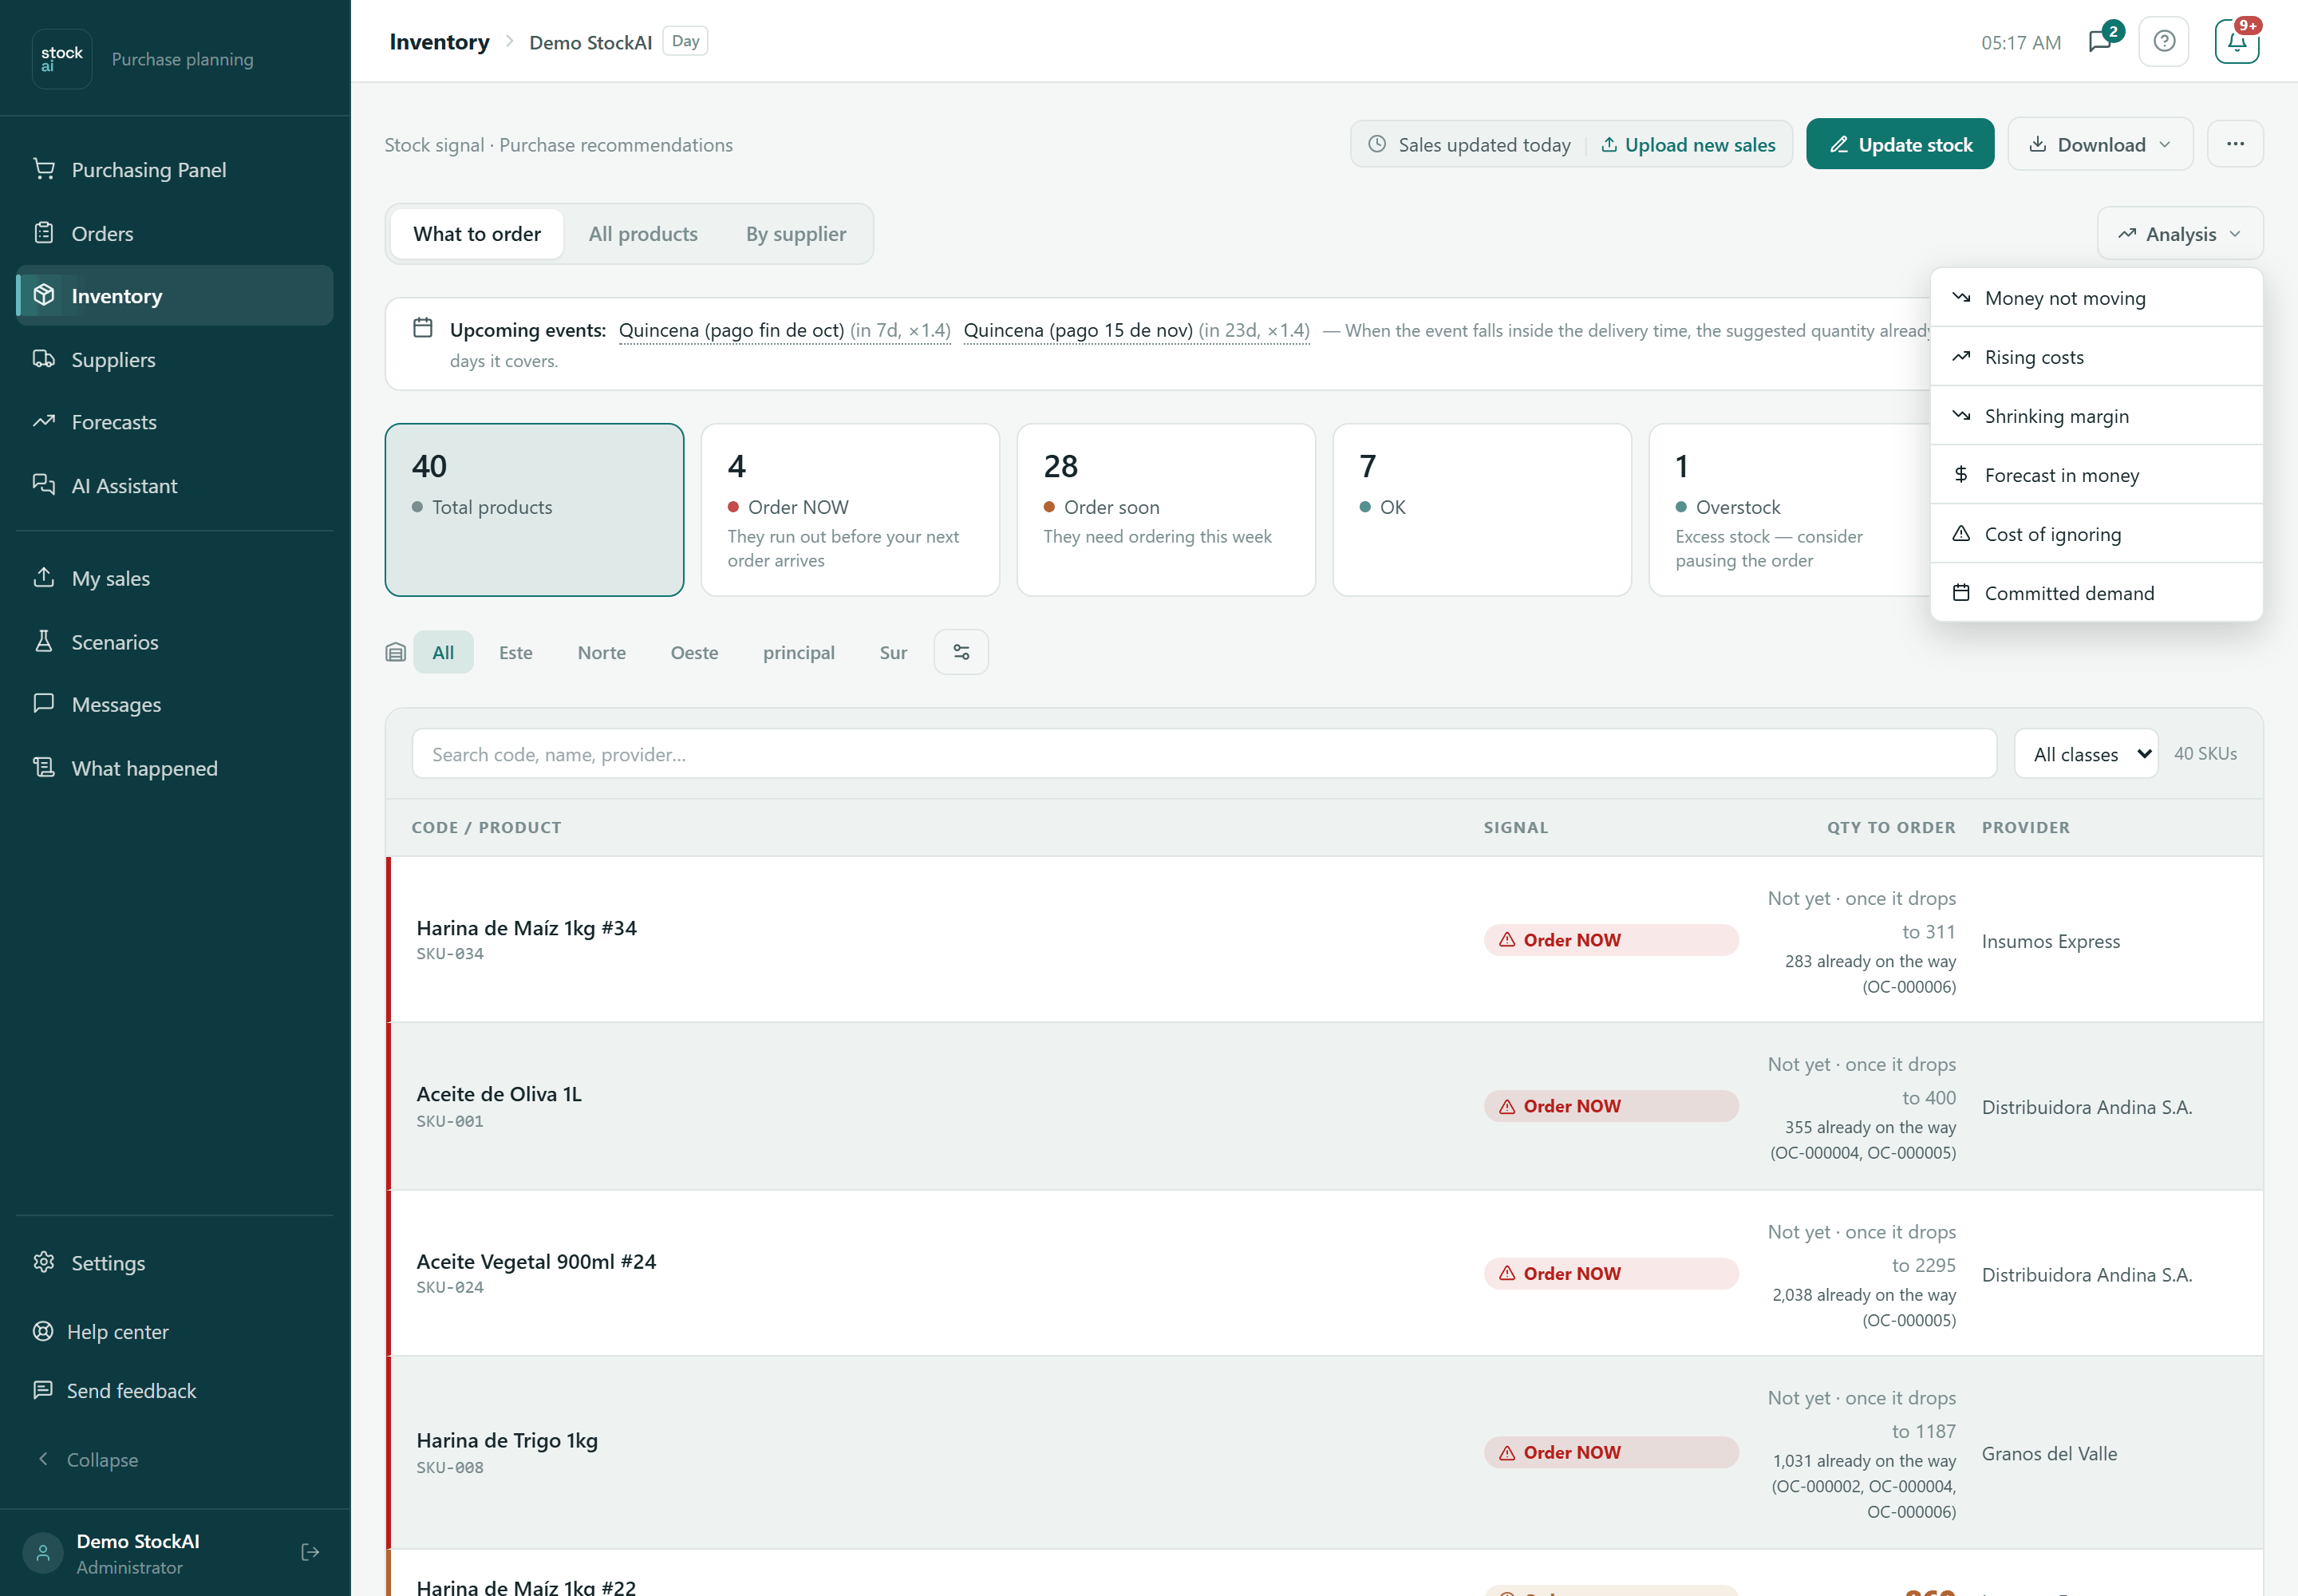
- Analysis
- A menu with six money and commitment views: Money not moving, Rising costs, Shrinking margin, Forecast in money, Cost of ignoring and Committed demand. Opening one replaces the tabs with “Back to inventory” and the view's name.
The summary cards and the filters
The six cards summarise the whole catalogue, not just the page you see. Click a signal card to filter the list; click again to clear it.
- Total products
- How many products there are. A click clears the signal filter.
- Order NOW
- “They run out before your next order arrives”.
- Order soon
- “They need ordering this week”.
- OK
- Healthy stock.
- Overstock
- “Excess stock — consider pausing the order”.
- Inventory value
- Stock times unit cost, summed, for the products with a cost on record only. With no cost at all it shows “—”: the value is unknown, not zero.
Under the cards is the search bar: “Search code, name, provider…” (the X clears it), the “All classes / Class A / Class B / Class C” selector that filters by ABC class (how much money the product moves) and the count of products that pass the filter. When nothing matches you see “No product matches the filter” and the “Clear filters” button.
Notices can appear above the cards: products you uploaded that were left out of the forecast (with the reason, such as too little history), “Upcoming events:” with each season and its multiplier (a click opens its simulation), and how many forecast products have no stock on record.
The full table (All products)
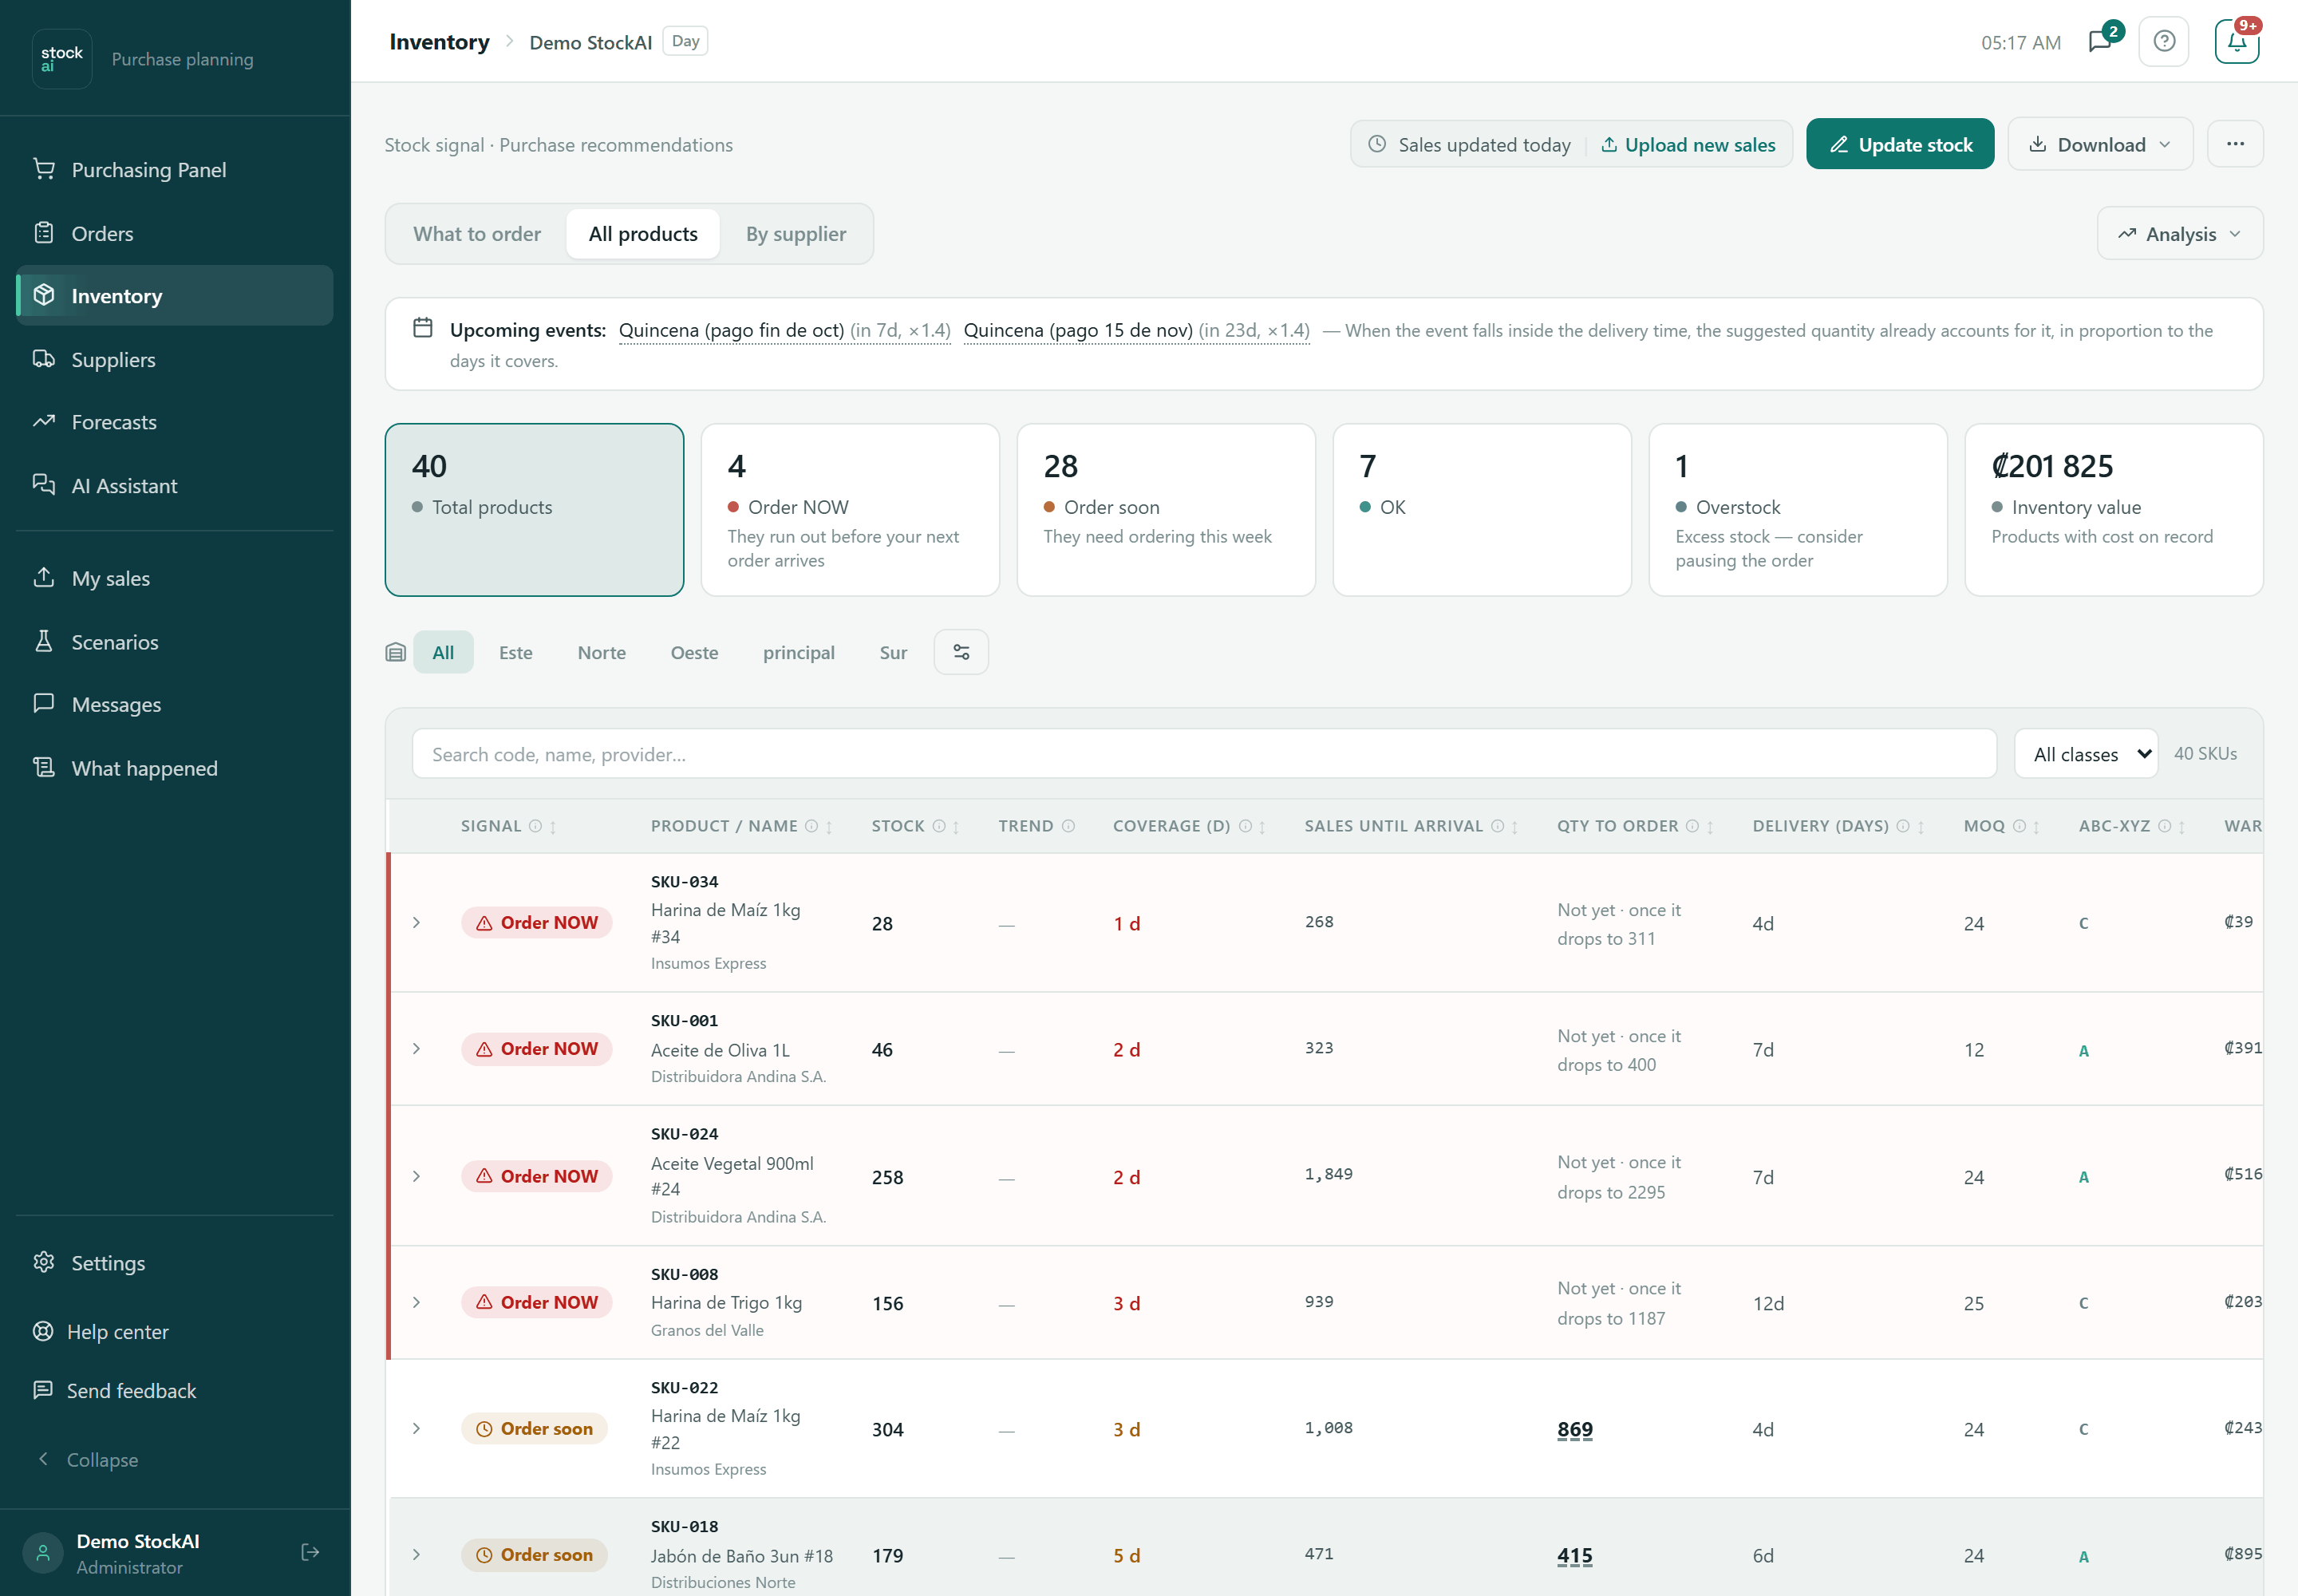
- ▶ (See how this was calculated)
- Opens the calculation breakdown under the row: see A row's breakdown.
- Signal
- The product's stock signal colour. See The stock signal.
- Product / Name
- The code, the name, the supplier and, with several warehouses, how much each one holds. It may carry a tag: forecast by analogy (a new product using other products' forecast) or “From customer commitments” (the need comes from committed orders only).
- Stock
- Units on hand today. “No record” if it was never loaded.
- Trend
- How your stock moved in the last 14 days (red falling, green stable or rising).
- Coverage
- How many days (or weeks or months, depending on your granularity) your current stock lasts.
- Sales until arrival
- How much you expect to sell while the order travels.
- Qty to order
- What you should order today. Click the number to type another quantity (it gets a coloured underline); that is the quantity “Export PO (edited)” uses. “Not yet” means it is not needed yet, sometimes with the stock level it waits for.
- Delivery (days)
- The lead time used. A tag says where it came from: yours, learned from real deliveries, from a supplier rule, or assumed (15 days).
- MOQ
- The supplier's minimum order. We never recommend less.
- ABC-XYZ
- A/B/C is how much money it moves; X/Y/Z how predictable its sales are. AZ is the trickiest.
- Warehouse value
- Stock times unit cost. Only when you recorded the cost.
- Actions
- Simulate scenarios (the sliders icon, opens the breakdown with the simulator), Edit (pencil) and Delete (bin, only when the product has a stock record).
A row's breakdown
Opening ▶ shows, in the order of the calculation: coverage, forecast daily demand, lead time, safety buffer, reorder point and why the suggested quantity is what it is (minimum order included). Below come “Why did this number change?” (what changed since the previous day, and whether it came from a forecast update or from your business), the manual forecast adjustment, the planning values with their origin and the “Scenario simulator”: move the lead time, the demand variation and the extra stock on hand to compare the “Original recommendation” with “With these changes”. The simulator saves nothing.
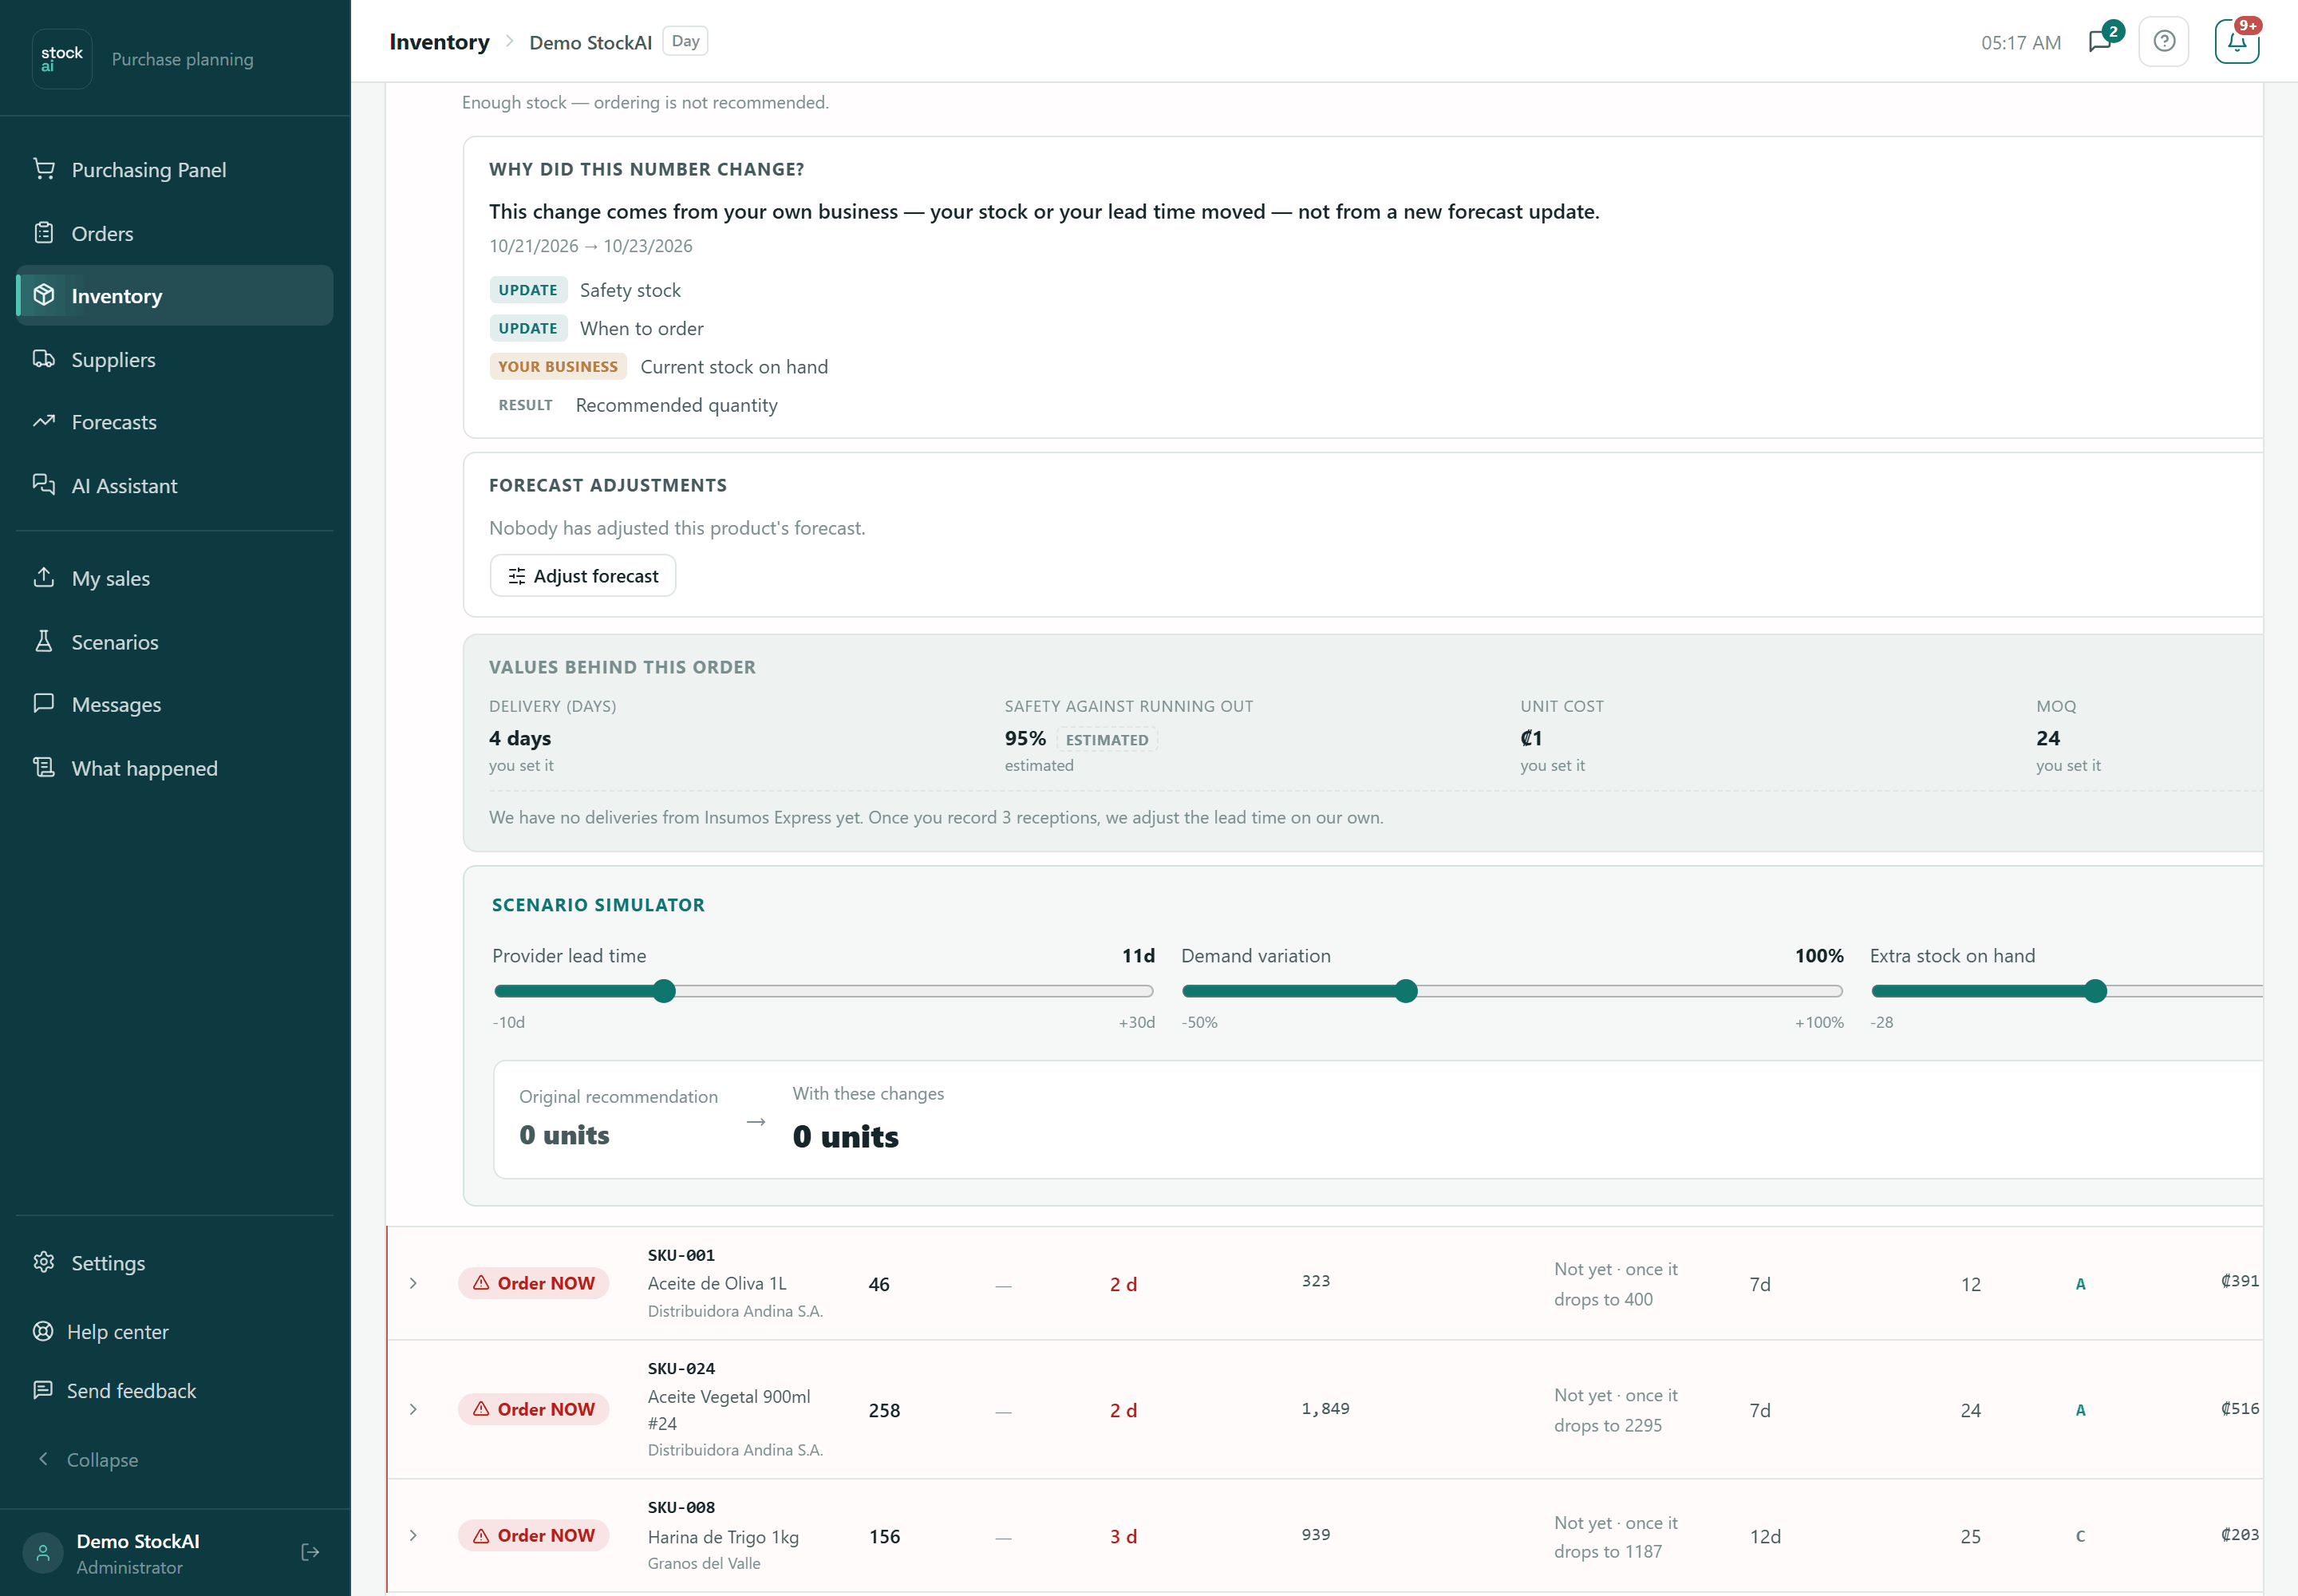
To understand the pieces of the calculation, read Reorder point, Safety stock and In transit.
Editing a product by hand
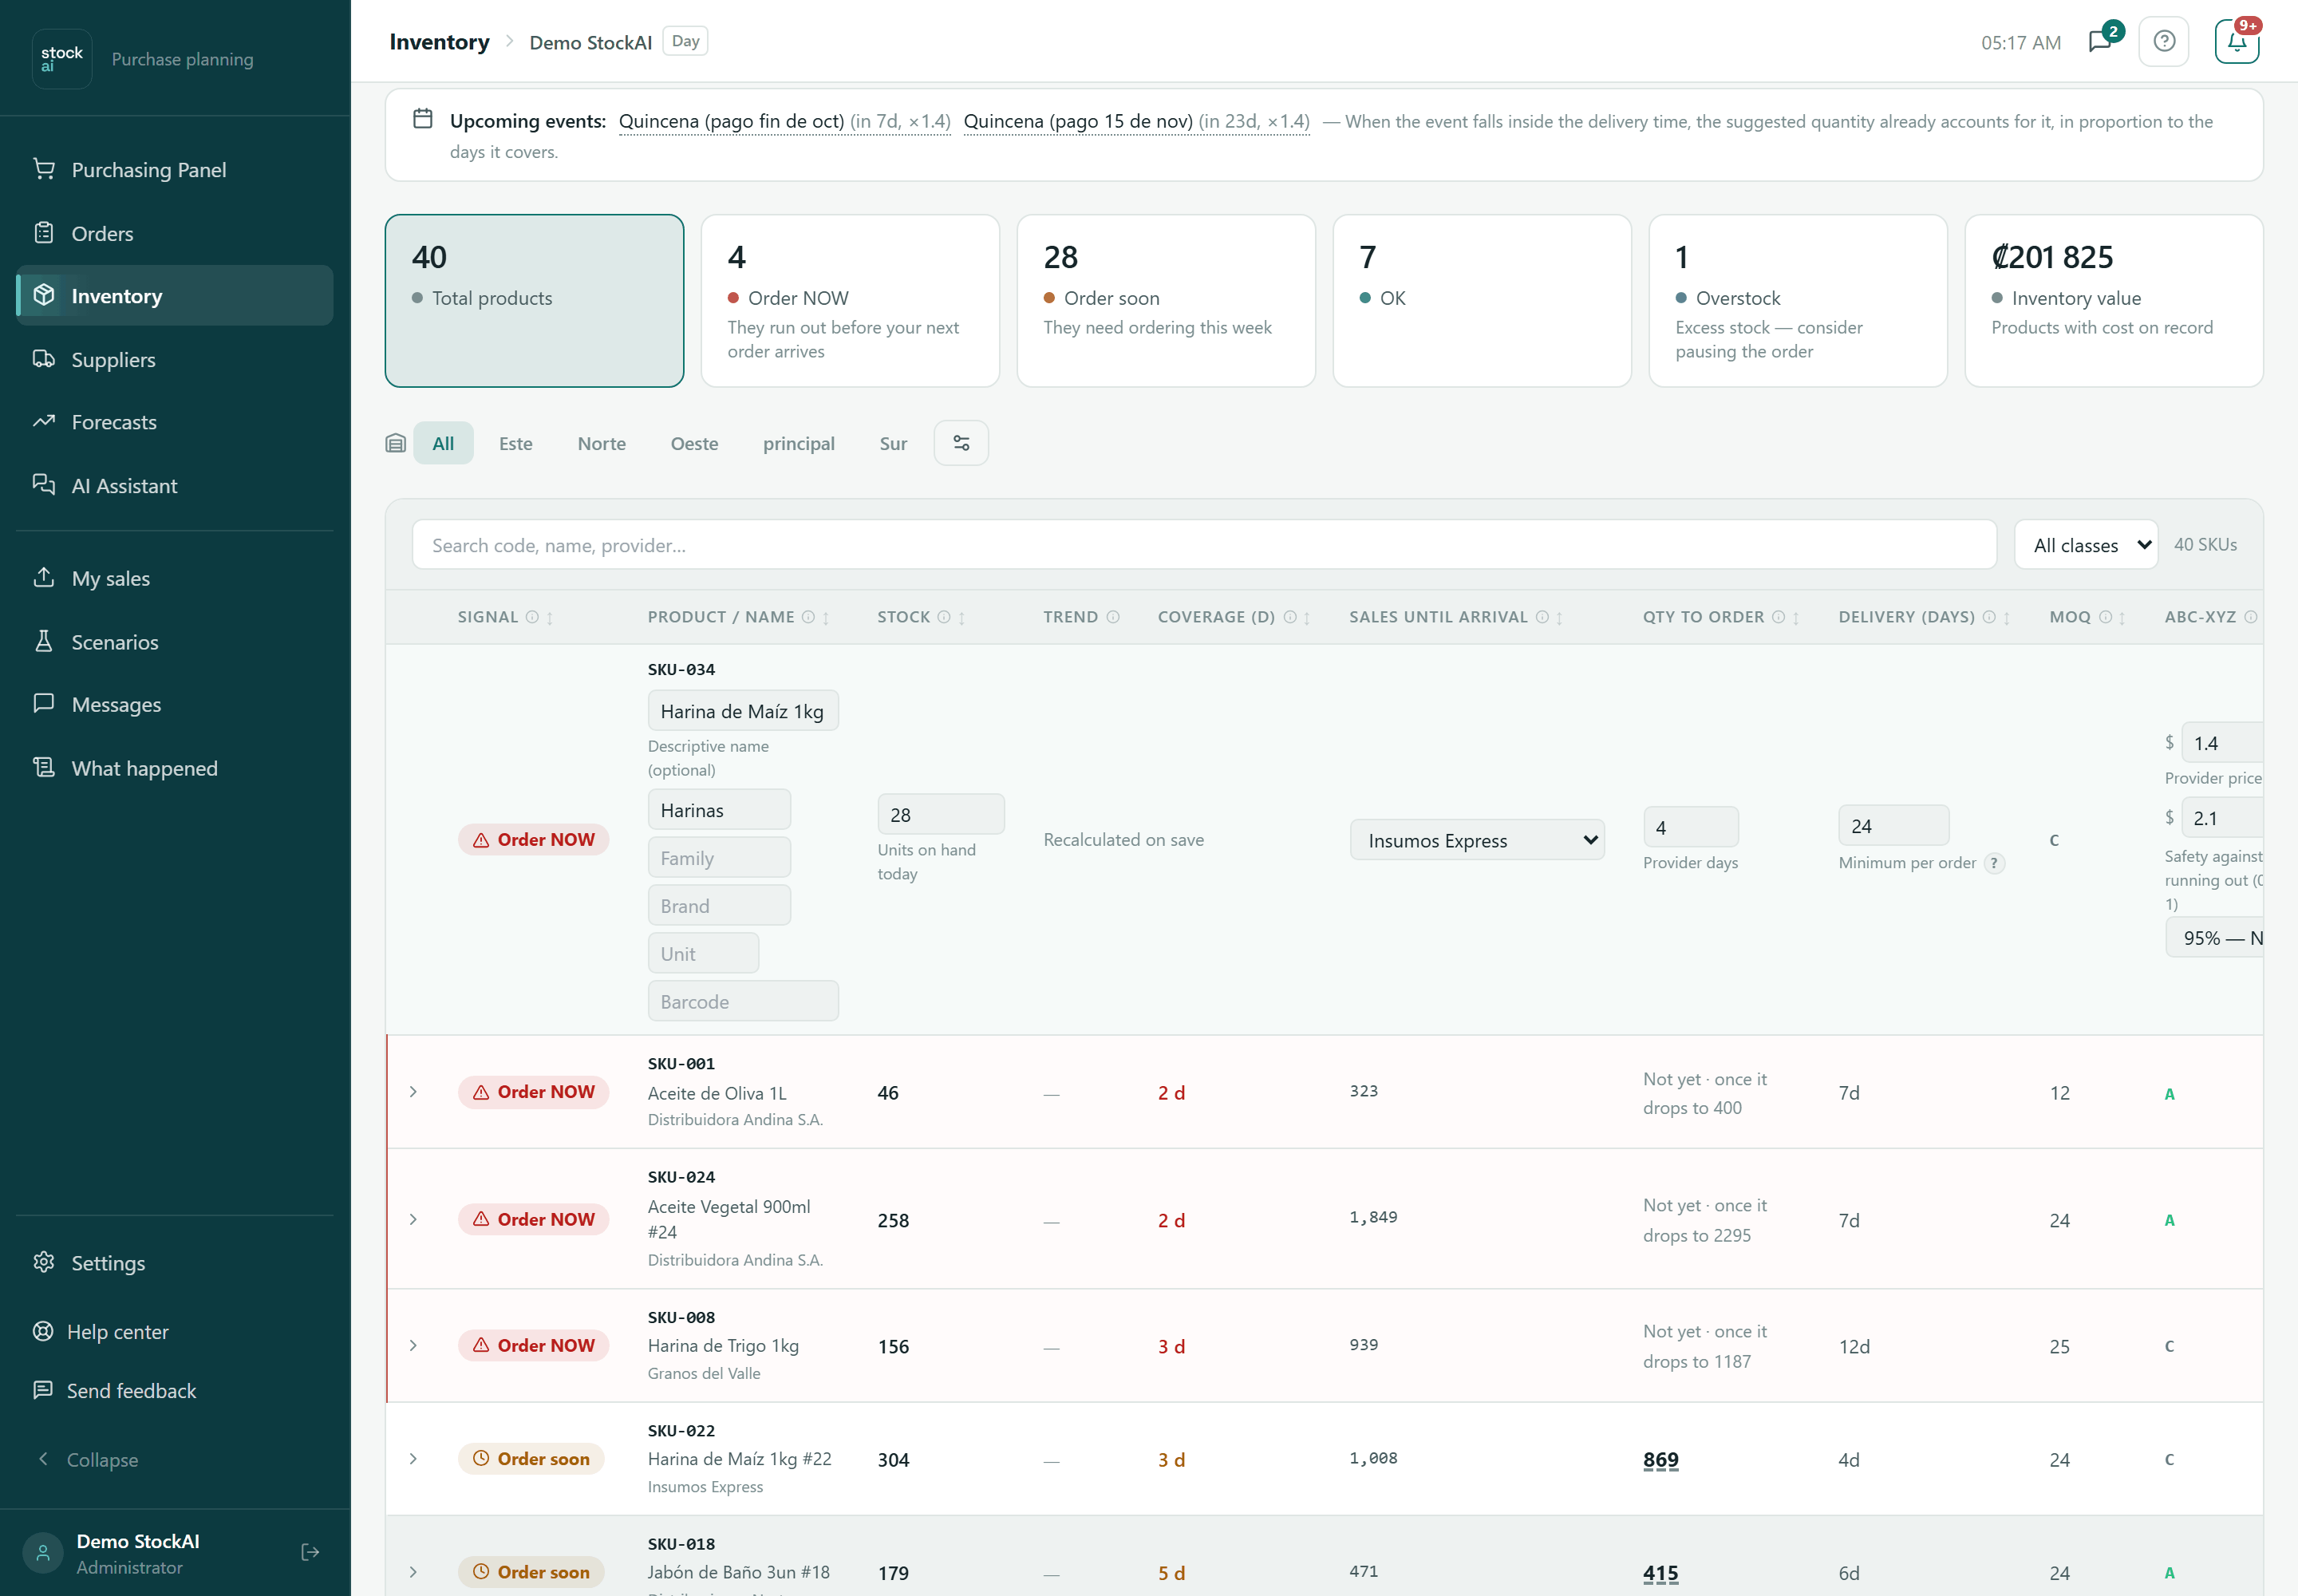
- In “All products”, press the row's pencil (Edit). The row turns into a form.
- Change what you need: Display name, Category, Family, Brand, Unit, Barcode, Current stock (units on hand today), Provider (your supplier list or “— No provider —”), Delivery days (1 to 365), Minimum per order, Provider price / unit, Sale price and Safety against running out: 90% Low, 95% Normal, 97% High or 99% Maximum.
- Press Save. Signal, coverage and quantity to order are recalculated on save. The X cancels without saving.
Update stock (the quick editor)
The fastest way to bring many rows up to date. Only analysts and administrators see it.
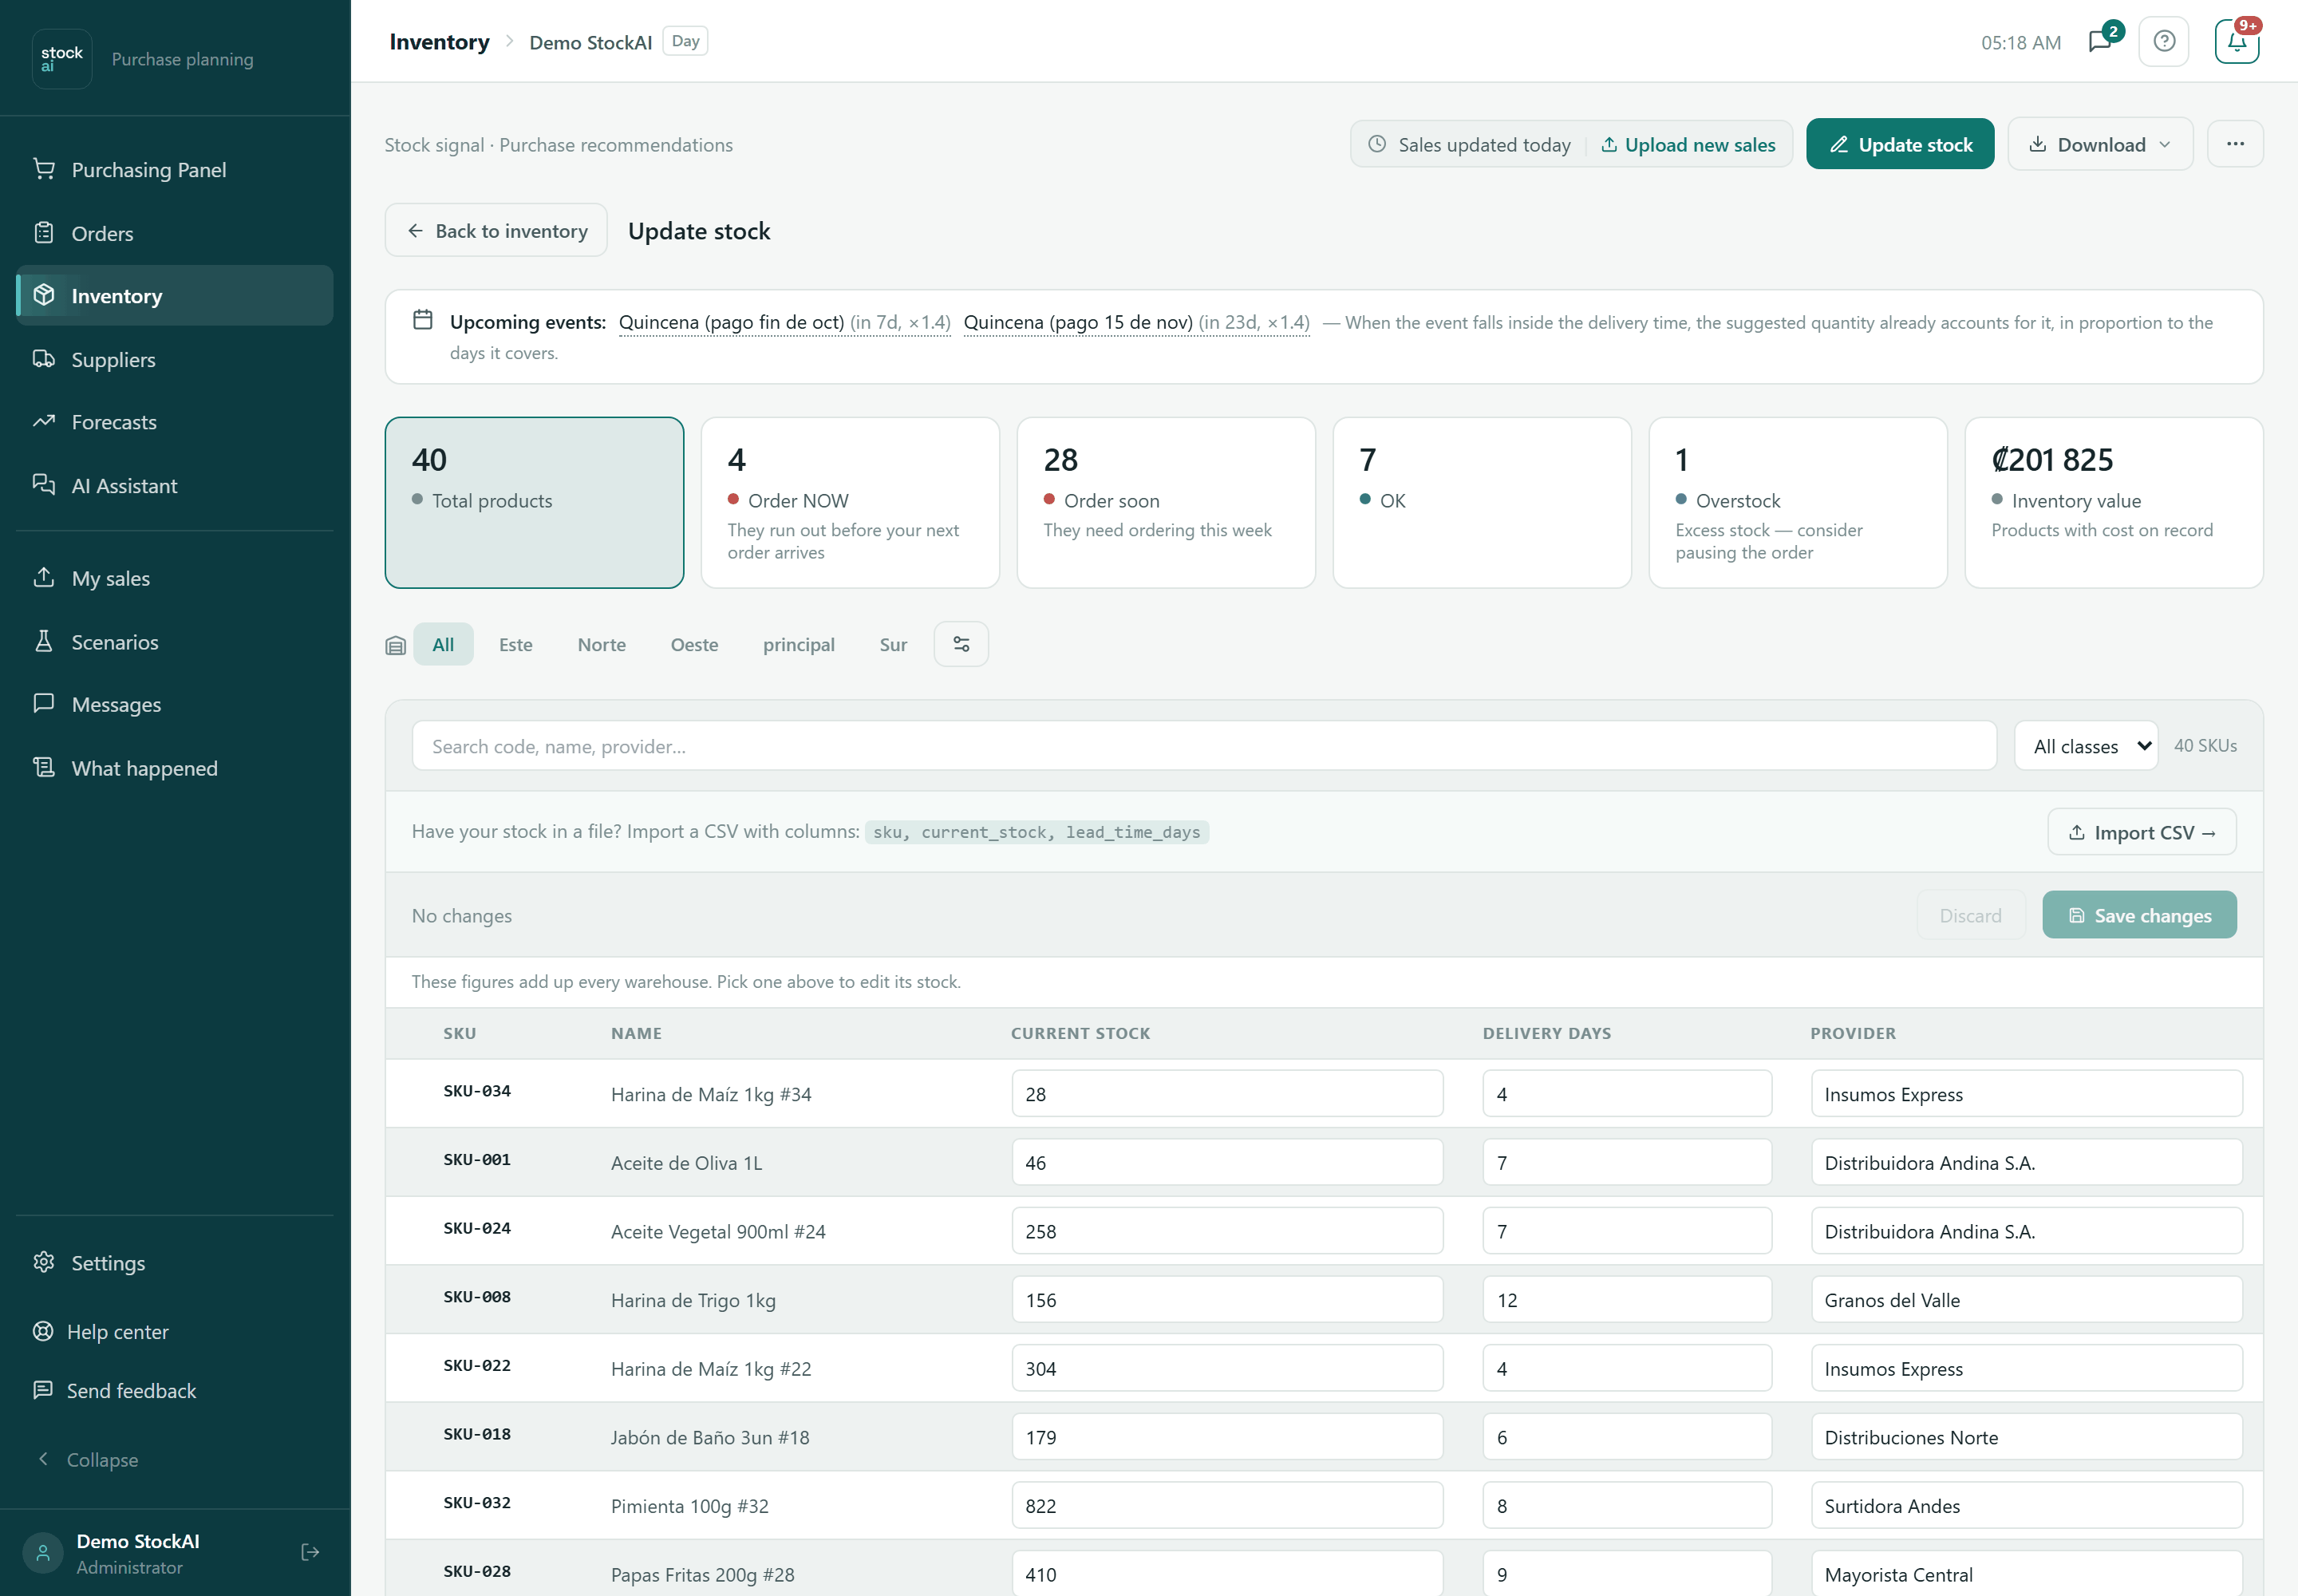
- Press “Update stock” at the top right.
- Type in Current stock, Delivery days or Provider on any row. An amber dot marks rows with unsaved changes and the bar counts how many rows you modified.
- Enter saves that row and moves to the next; Esc discards that row's changes.
- To save everything at once press “Save N changes”. Discard puts every row back. With several pages, what you changed on other pages is kept and saved too.
- Press “Back to inventory” to leave.
Above the editor is “Have your stock in a file? Import a CSV with columns: sku, current_stock, lead_time_days” with the “Import CSV →” button.
Importing stock from a CSV
“Import stock (CSV)” (in the … menu) and “Import CSV →” open the file picker. The file needs the sku column; we also recognise current_stock, lead_time_days, unit_cost, sale_price, moq, supplier, warehouse and others (download the Template from the Download menu). Rows with no warehouse column land in the warehouse you have selected, or in the main one on “All”. When it finishes you see “Inventory imported: Imported N of M SKUs”. If a sync owns some of those values, before importing you are told “A sync will replace some of these values” and can press “Import anyway”. To map columns with other names, use the wizard in Set up inventory.
Logging a stock-out (shrinkage)
For units that left without being sold: breakage, expiry, self-consumption, gift or sample. Stock is decremented immediately and the cost accumulates in the shrinkage summary.
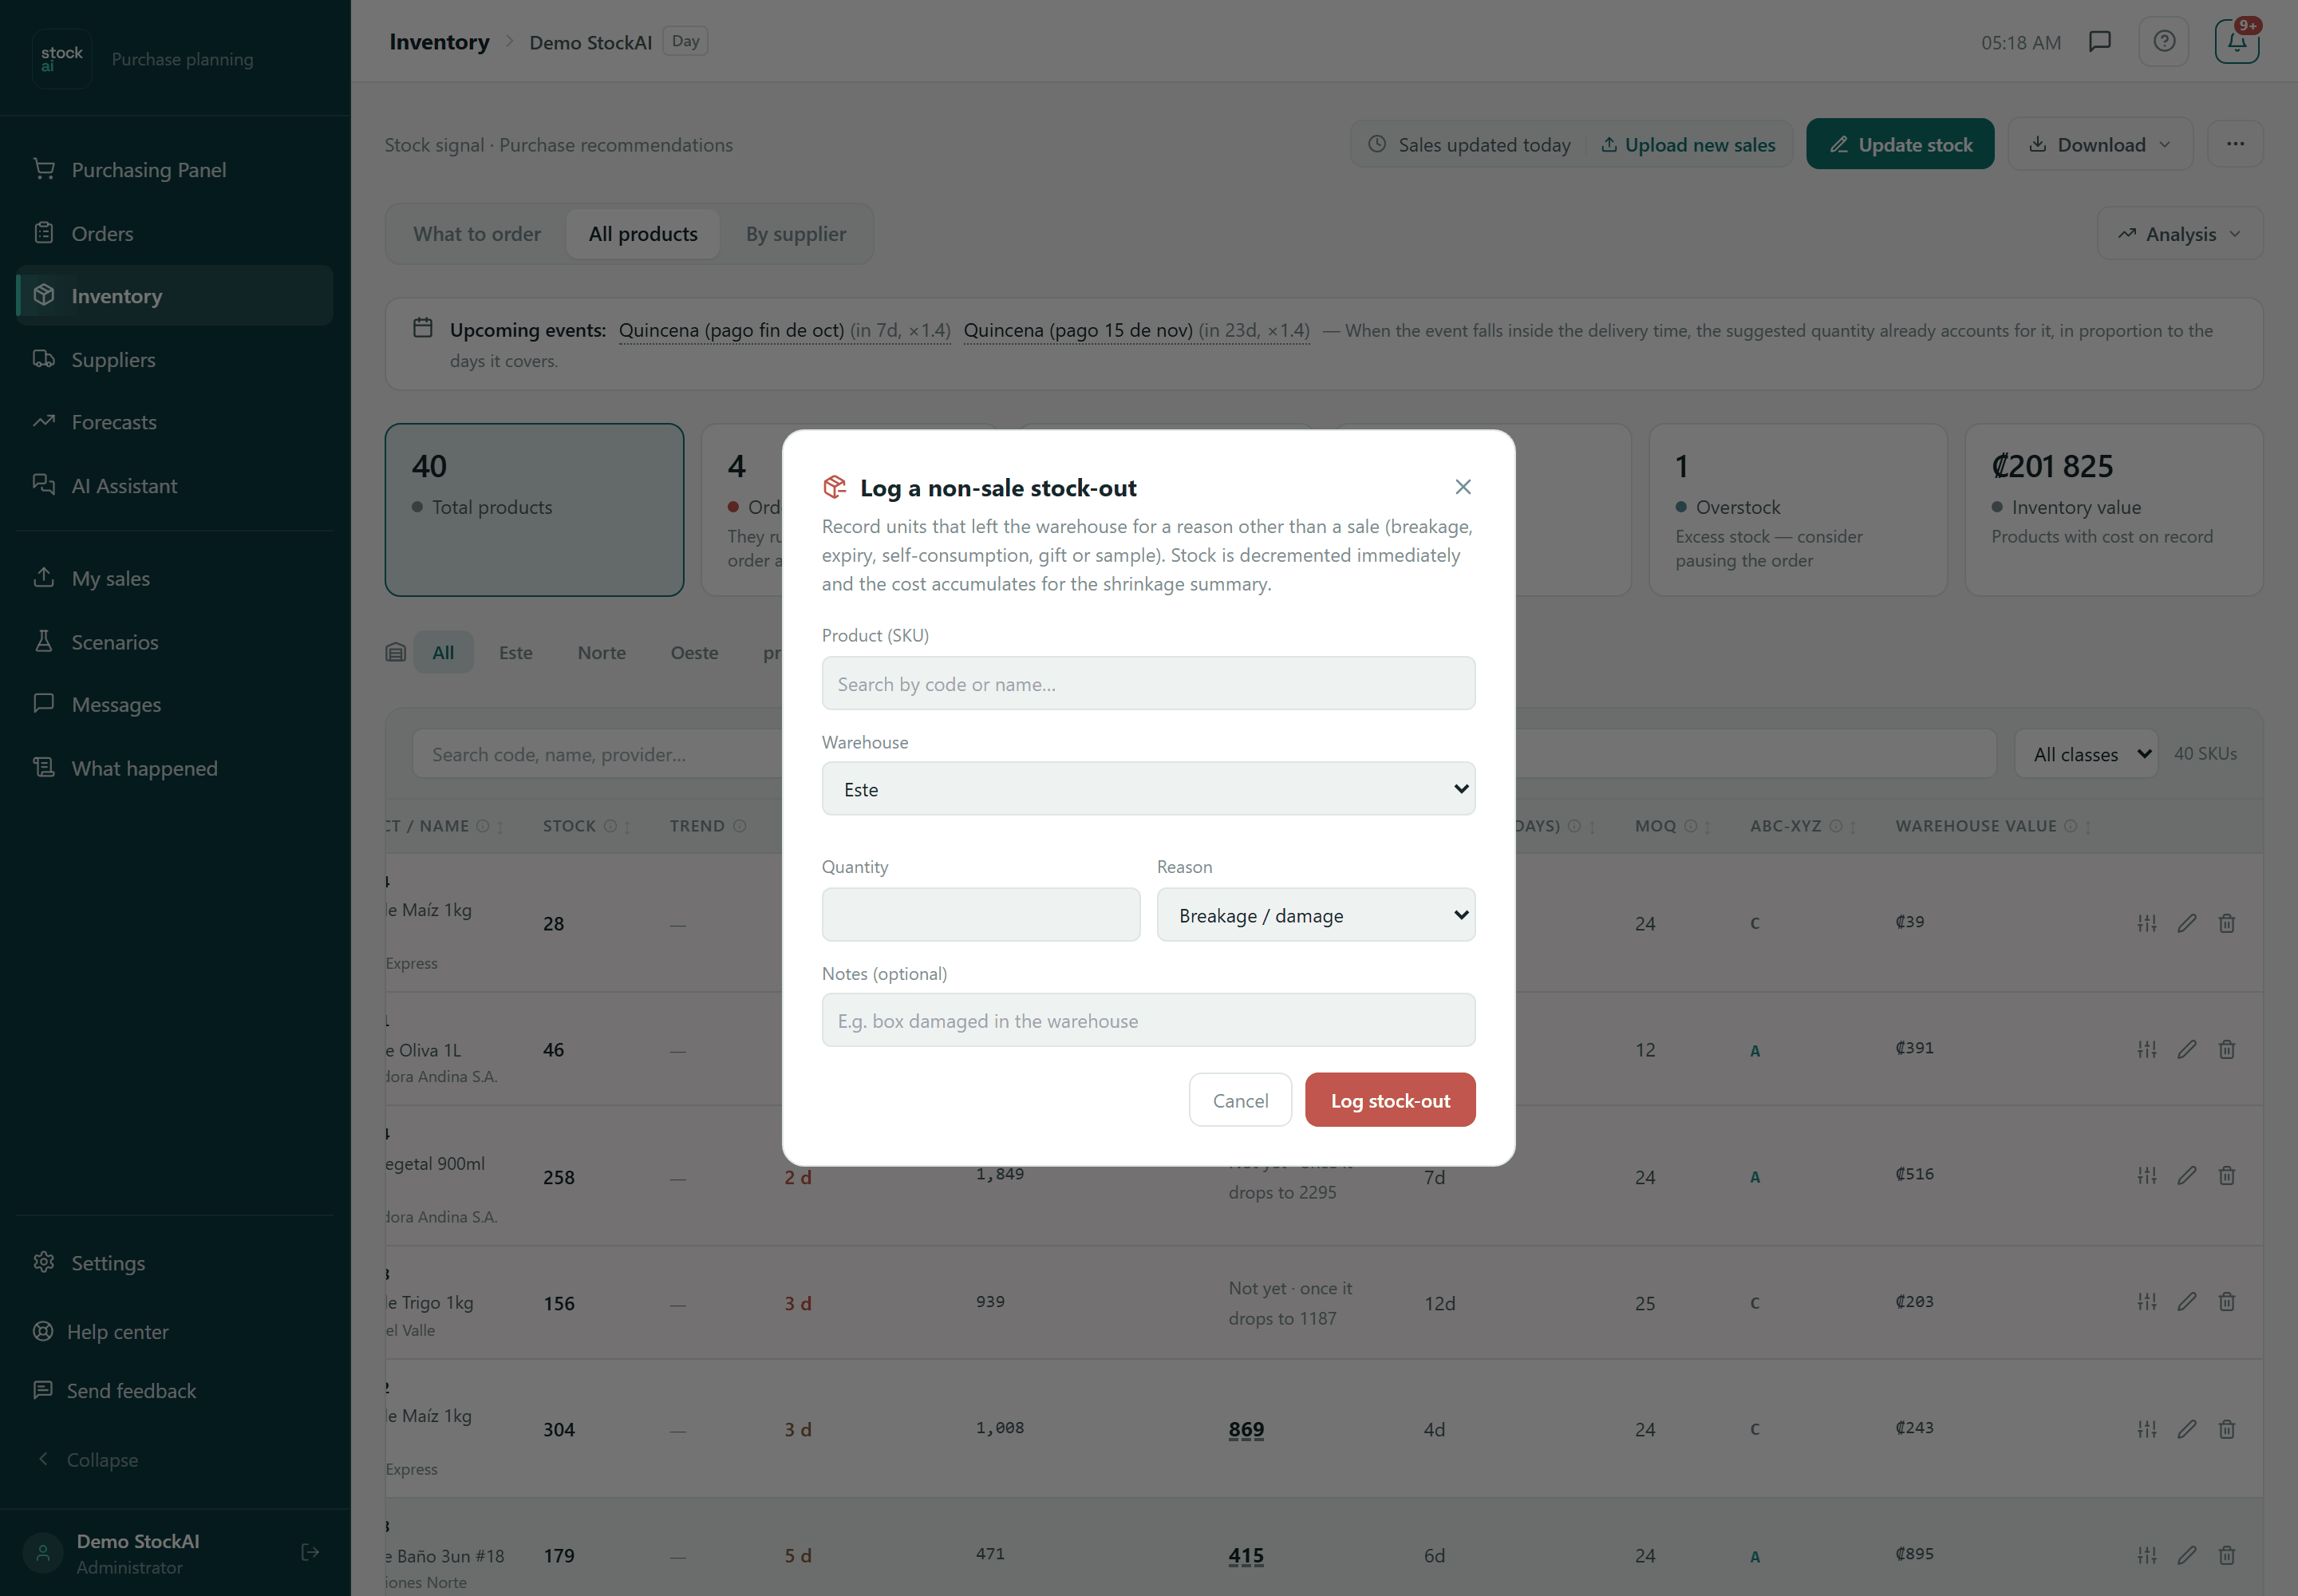
- Open the … menu and choose “Log stock-out”.
- In Product (SKU) search by code or name and pick one. Below you see its Current stock and the Estimated cost of the stock-out.
- With several warehouses, choose the Warehouse. It starts on the warehouse you have open; on “All” it starts on the first one in the list, which is not always the main one: check it before logging.
- Type the Quantity (greater than 0) and the Reason: Breakage / damage, Expiry, Self-consumption or Gift / sample. Notes are optional.
- Press “Log stock-out”. You see “Stock-out logged”.
Warehouses: the selector and its setup
With a single warehouse you only see the discreet “+ Add warehouse” link. With two or more the selector appears: “All” and one tab per warehouse, and next to it the gear icon “Warehouse setup” (analyst or administrator).
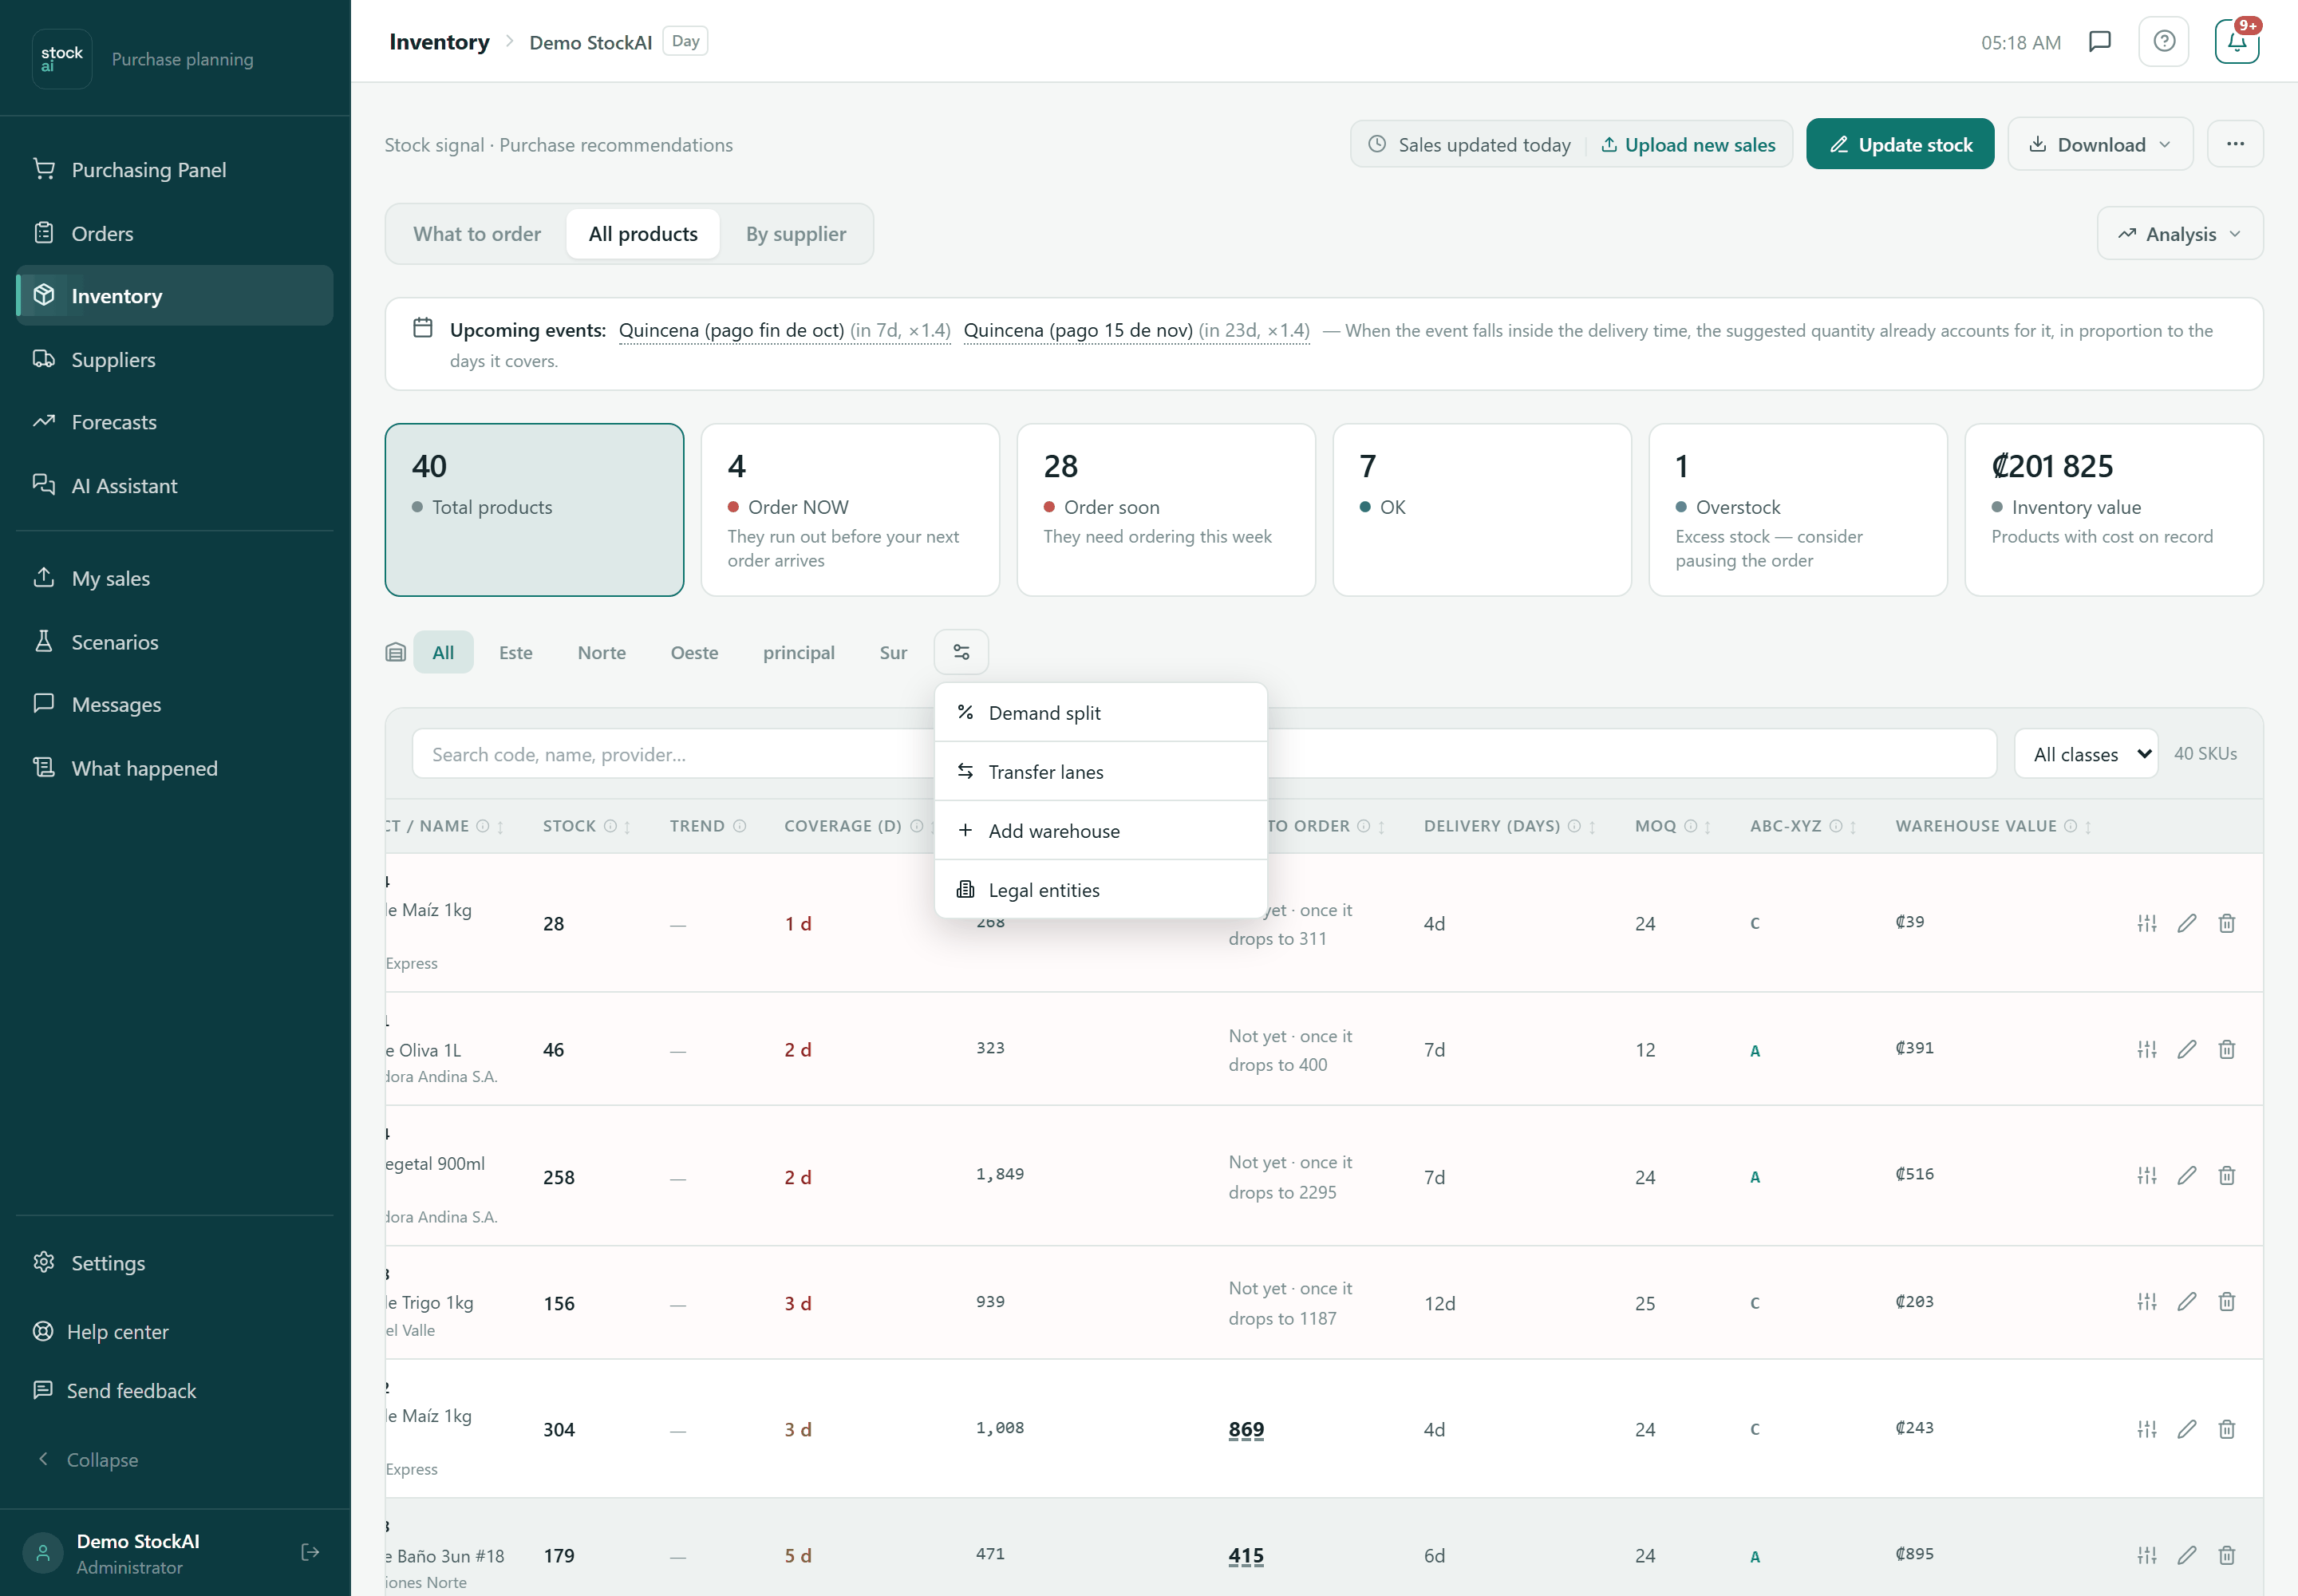
- Demand split
- “What % of sales happens at each warehouse?”. Type a percentage per warehouse and press Save. The numbers need not add up to 100: demand is split in proportion. Careful: a blank warehouse gets zero demand and drops out of planning, and the screen warns you in red before saving (“Will apply as: …”). With no split at all, all demand goes to the main warehouse.
- Transfer lanes
- How long moving stock between two warehouses takes and what it costs: From, To, Days, Cost per unit and Fixed cost, then “Save lane”. The X deletes a lane. With no lanes, StockAI assumes 1 day and zero cost. StockAI uses lanes to decide whether a transfer beats a purchase.
- Add warehouse
- Type the Warehouse name and press Save (or Enter). Your plan limits how many warehouses you can have. A warehouse cannot be deleted.
- Legal entities
- Administrator only. “Legal entity of each warehouse (empty = not set)”. Type each warehouse's legal entity and press Save. A transfer between warehouses of different entities waits for an administrator to approve it; if either warehouse has no entity, the transfer is sent at once as always.



One warehouse's view
Picking a warehouse replaces the table with that warehouse's stock signal: SKU, Stock (editable), Coverage, Signal and Suggested action. On top, “Import a CSV (sku, current_stock, lead_time_days) and the rows land in …” with “Import CSV →”: rows with no warehouse column land in the open warehouse.
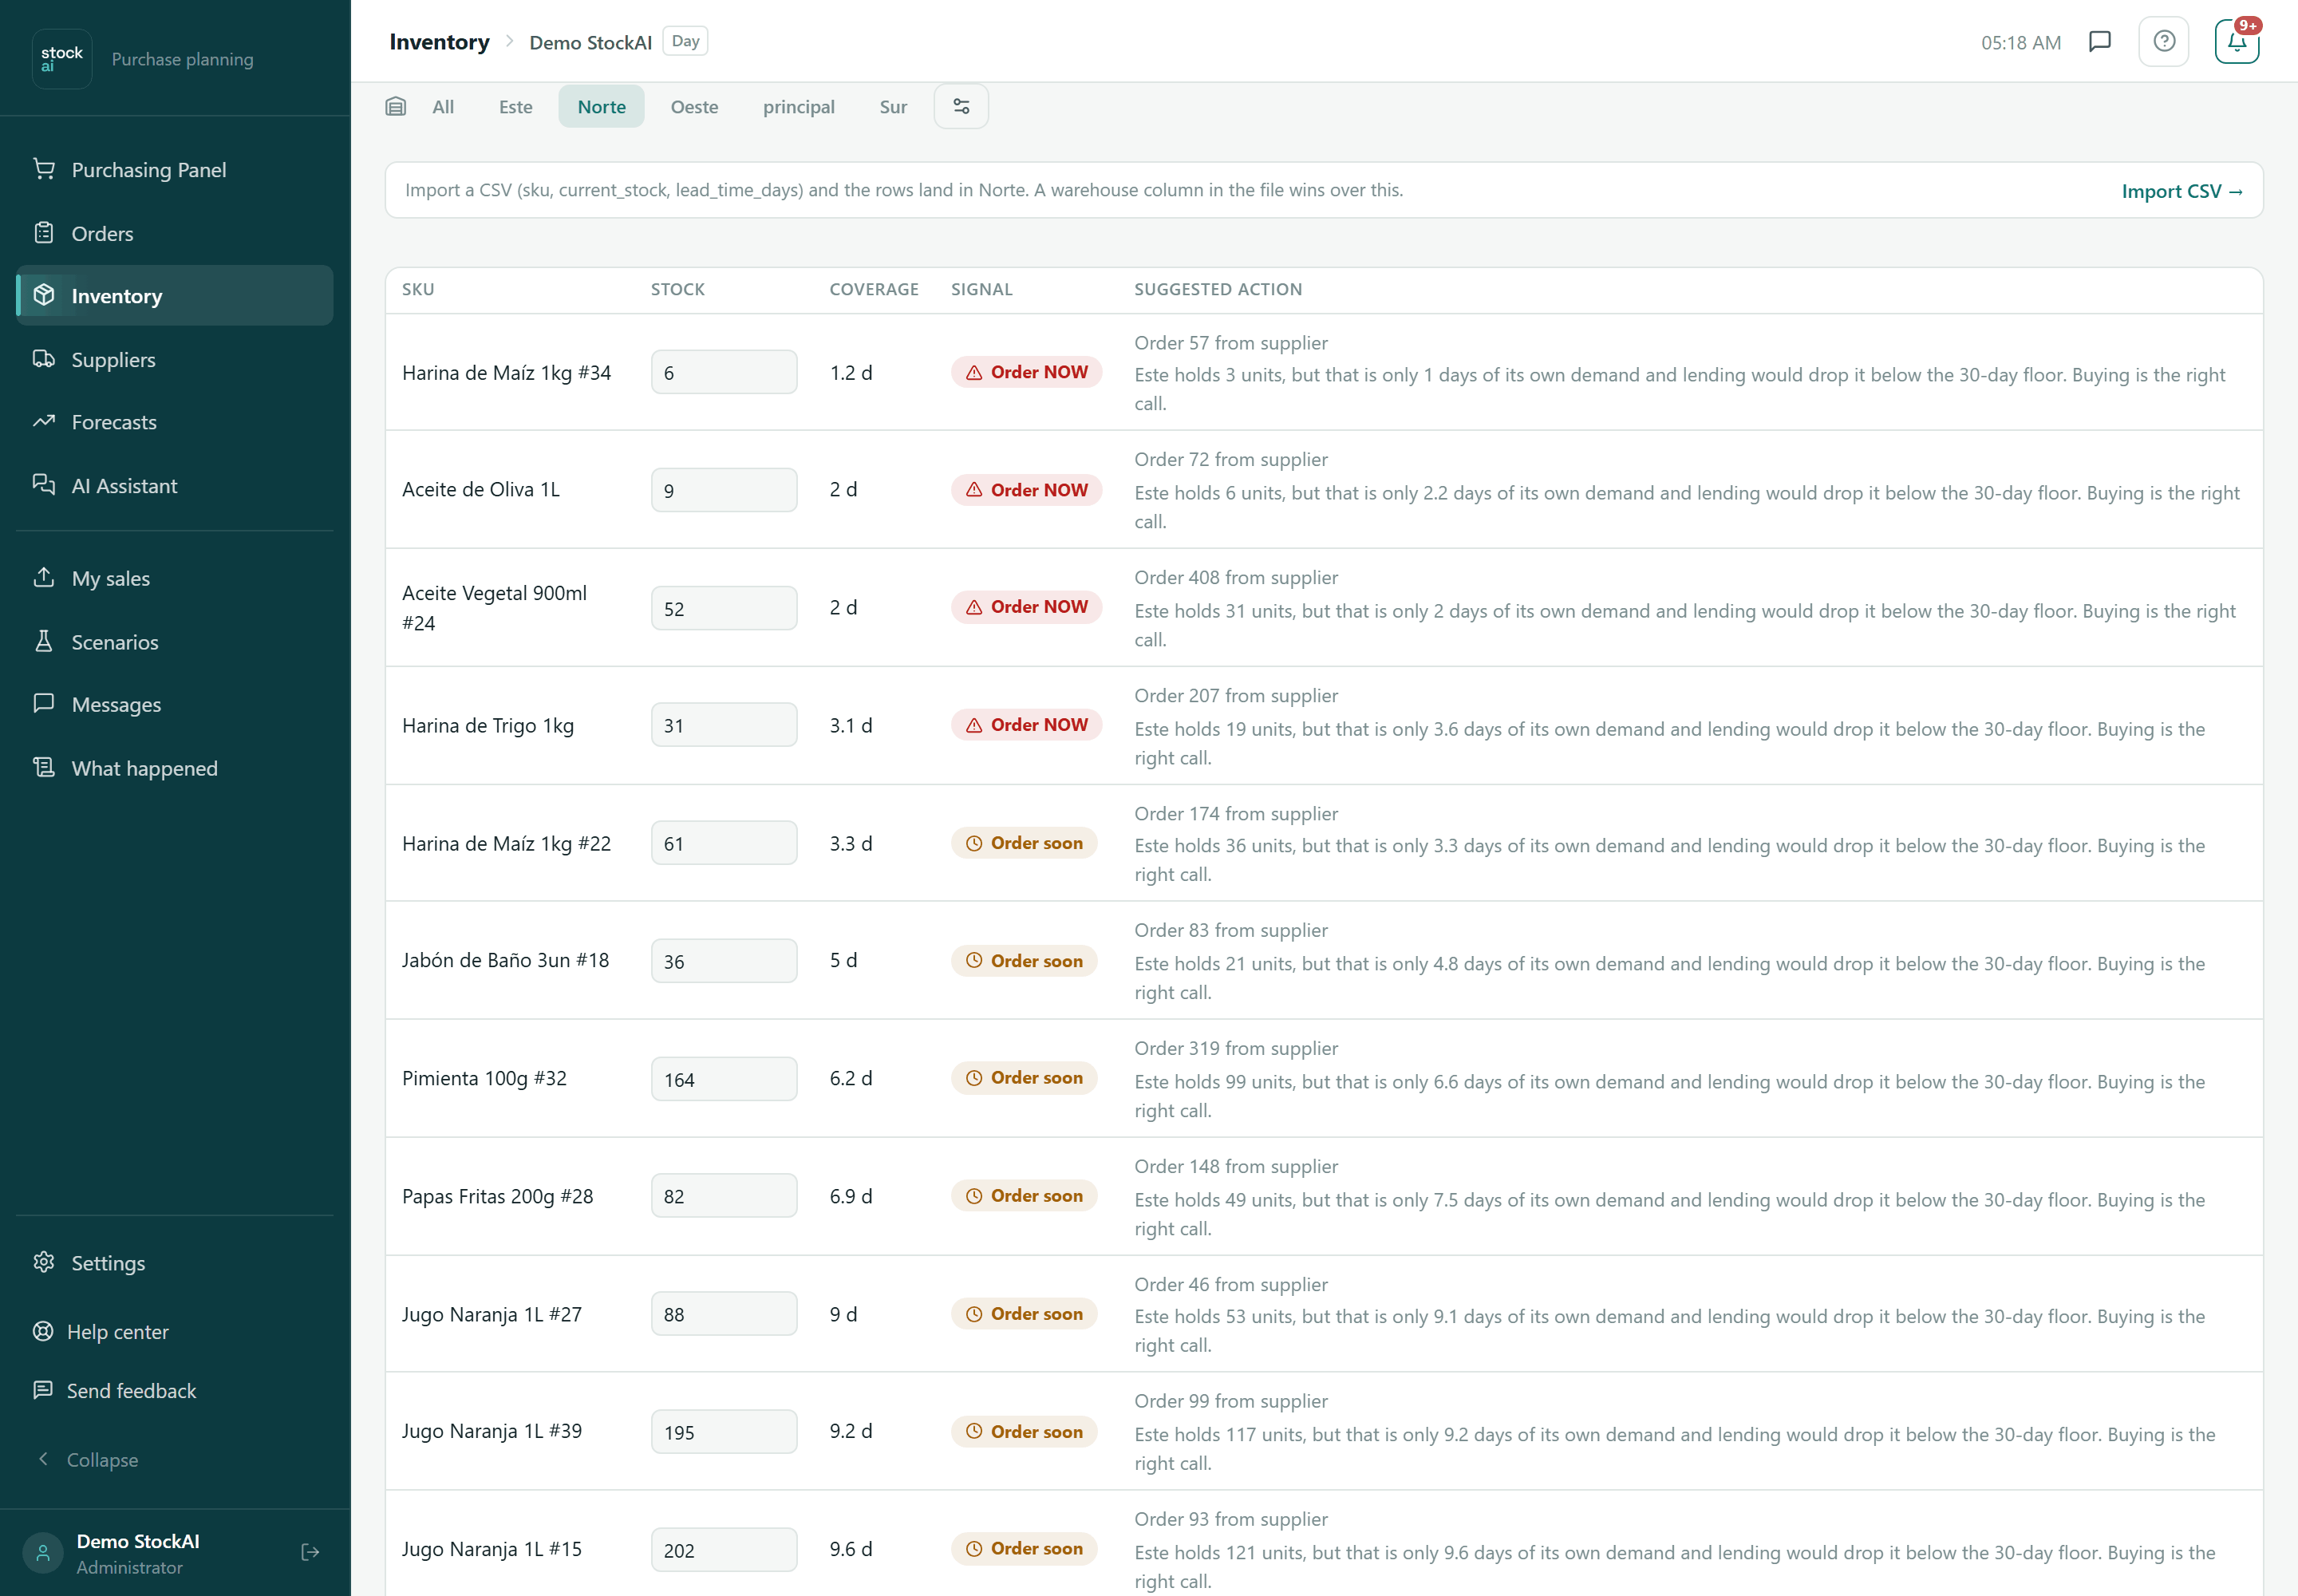
- Stock
- Type that warehouse's quantity and press Enter (or leave the field) to save; Esc discards. The value is stored in that warehouse, not across the network.
- “No data” signal with a note
- “Stock for this product was never recorded in this warehouse. That is not the same as zero: we do not know.” Load its stock so it gets a signal.
- Transfer N from X
- Another warehouse has spare stock and moving it beats buying. One click creates the transfer and the button turns into “Transfer created”.
- Order N from supplier
- Buying is better. Below may come why the transfer lost (slower, more expensive, would leave the other warehouse short).
- Move N from X and buy the other M
- The other warehouse can only spare part of it. One click creates that transfer; the purchase shrinks on its own because what is in transit is netted out.
Transfers between warehouses
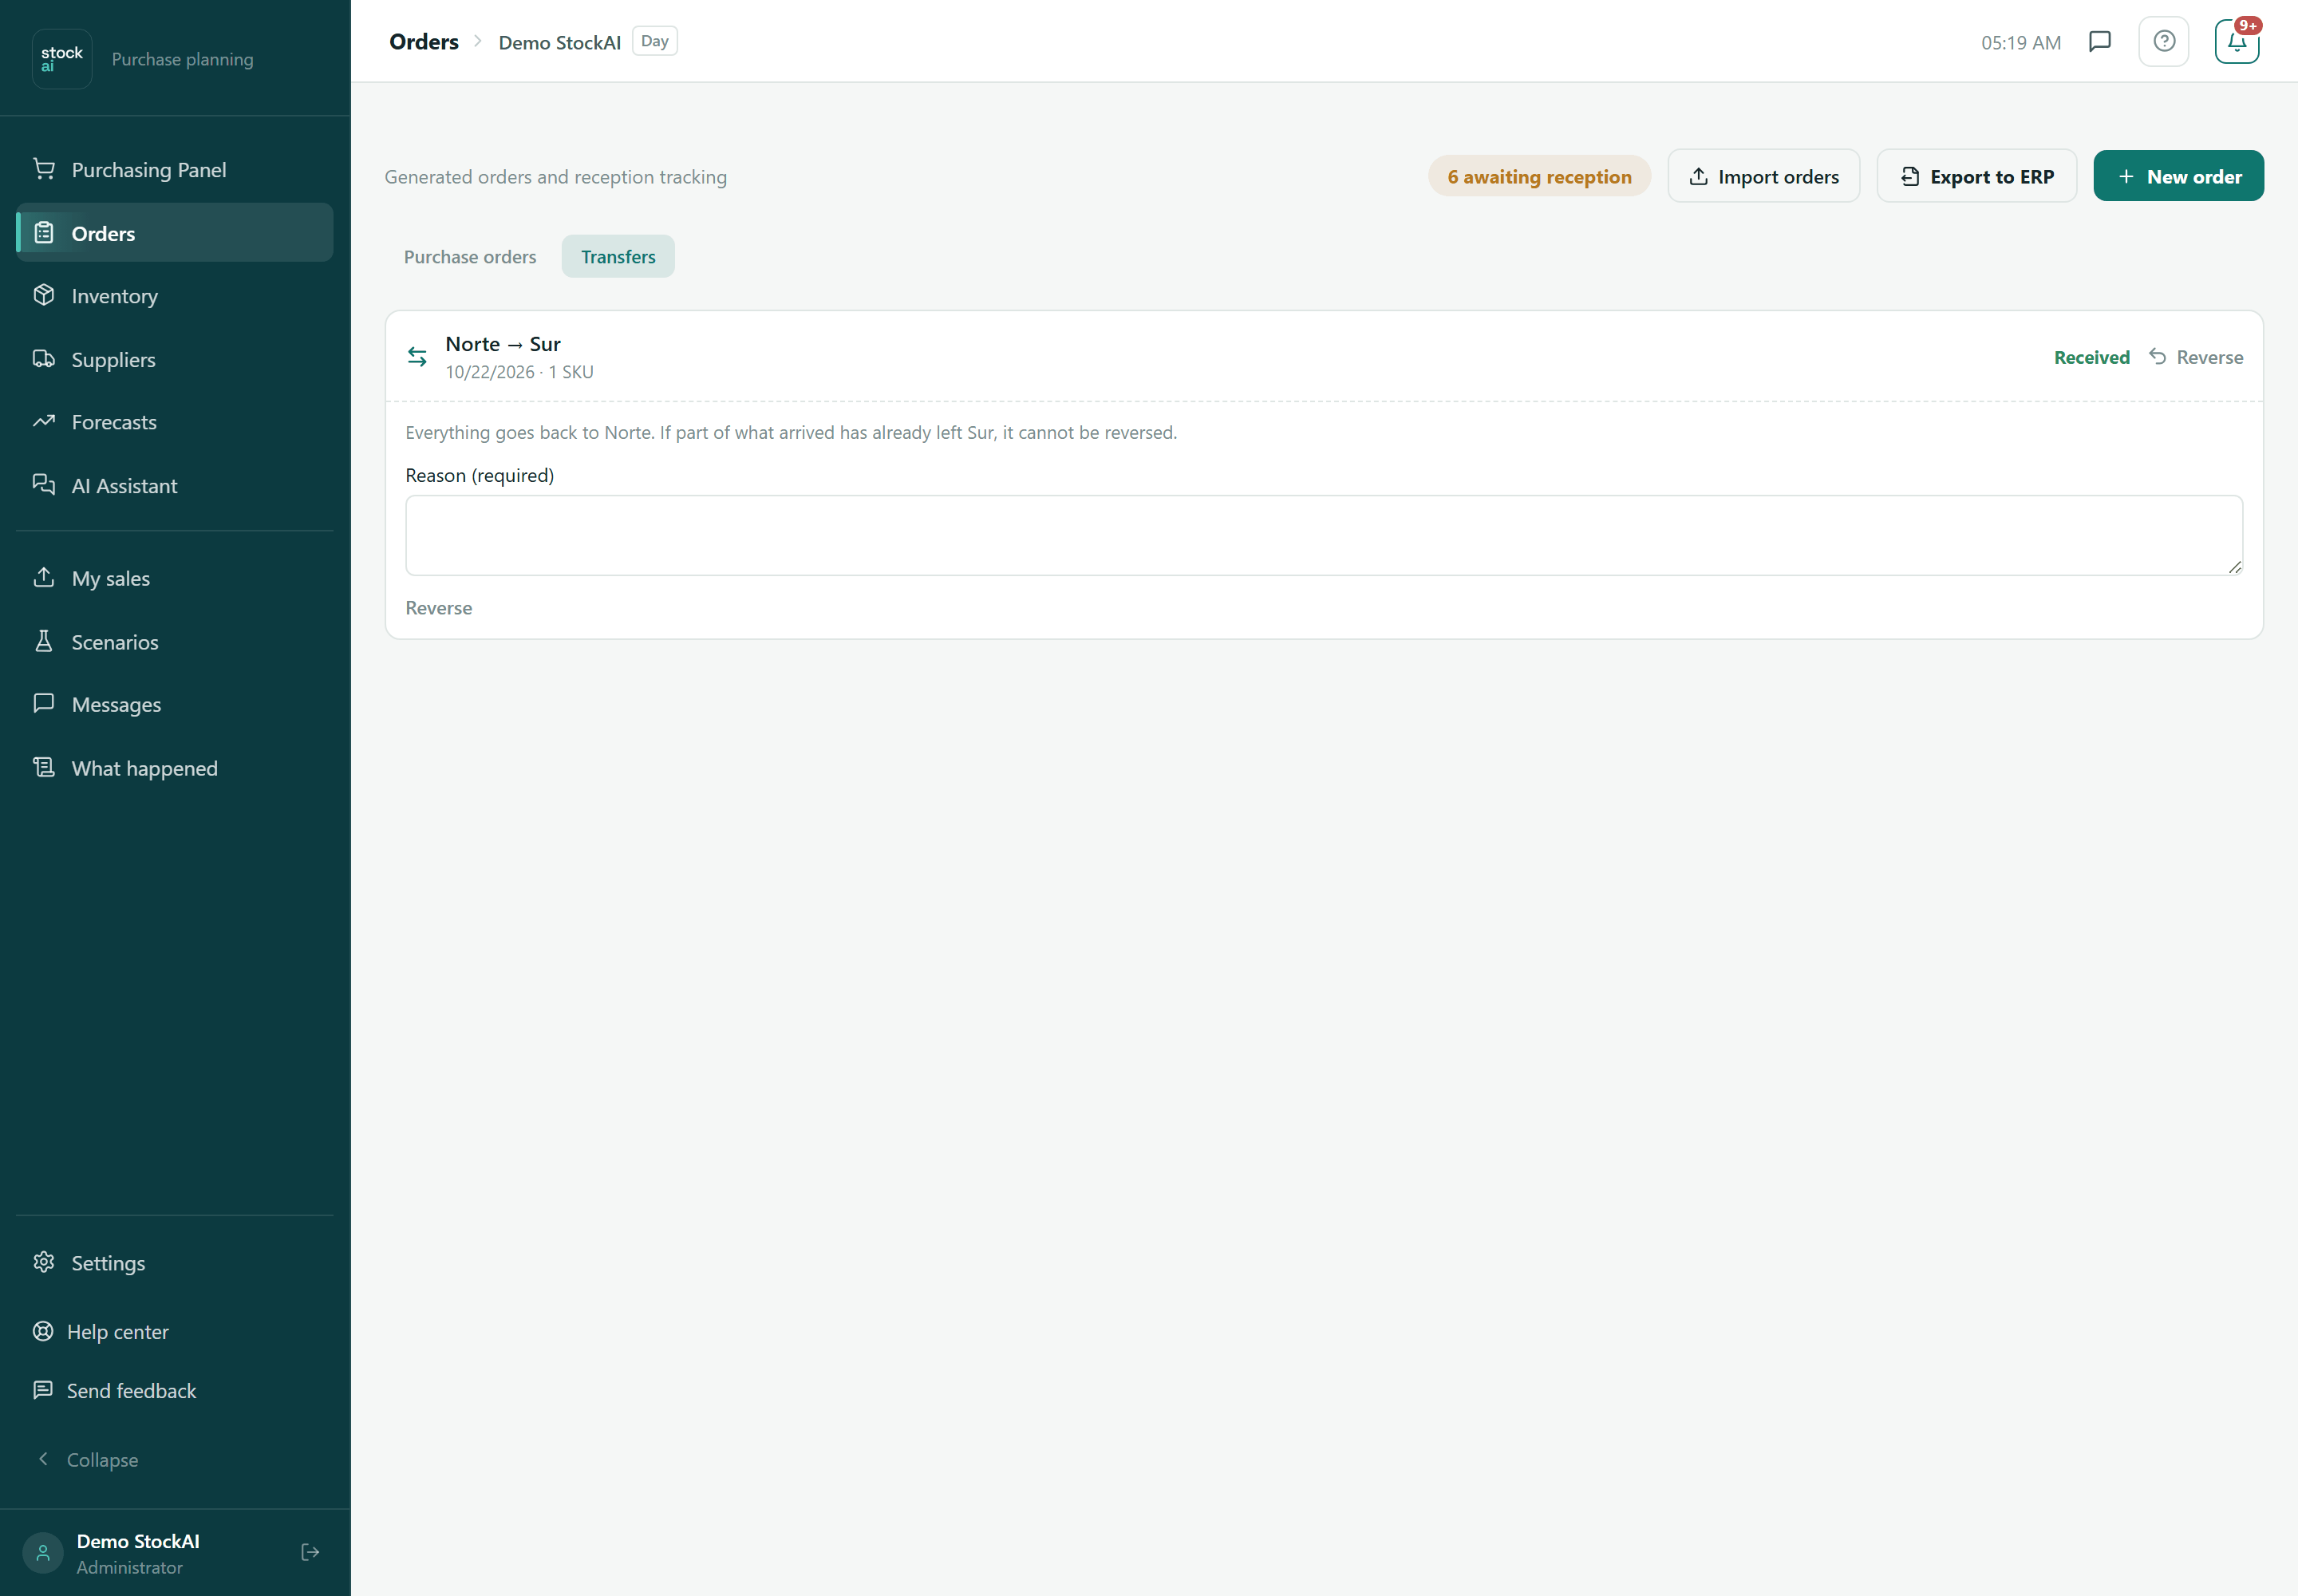
A transfer is born in a warehouse's view (or in the Purchasing panel) and is followed in Orders, “Transfers” tab (shown only with two or more warehouses). Each card shows origin → destination, the date, how many SKUs, the expected arrival and the status.
| Status | What it means | What you can do |
|---|---|---|
| Awaiting approval | It crosses two legal entities. No stock has moved yet. | Administrator: Approve (stock leaves the origin now) or Reject. Anyone with write access: cancel (X). |
| In transit | The stock left the origin and counts in no warehouse. | Record arrival (“Everything arrived” or “Record quantities”). If nothing has arrived: cancel (X), and stock goes back to the origin. |
| Partial | Part of it arrived. | Record arrival for the rest, Close with loss or, as an administrator, Reverse. |
| Received | Everything arrived. | Administrator: Reverse. |
| Closed with loss | The missing units became shrinkage (“Transfer loss”). Stock does not change: those units had already left. | Nothing. |
| Cancelled / Rejected / Reversed | Finished. A reversed one shows its reason. | Nothing. |
- If the two warehouses have different legal entities, the transfer waits as “Awaiting approval”. An administrator opens Orders › Transfers and presses Approve: the system checks again that the stock is there and takes it out of the origin at that moment. If it was sold meanwhile, the approval is refused and the transfer stays pending.
- When the goods arrive, press Record arrival. “Everything arrived” receives what is outstanding; “Record quantities” receives what you type on each line (“Outstanding: N”). Partial arrivals add up.
- If what is missing was lost, press “Close with loss”: the outstanding units become shrinkage and the transfer closes.
- To undo a received or partial transfer, an administrator presses Reverse, writes the Reason (required) (up to 500 characters) and confirms. Everything goes back to the origin: what was received leaves the destination and what was still on the road comes home.
Transfer suggestions
On the Purchasing Panel, before the purchases, you see how many products can be solved by moving stock instead of buying: another warehouse has a surplus of them. Each line says how much to move, from where to where and how much coverage the origin keeps. In Inventory, when looking at one warehouse, the row can offer to transfer N from another warehouse, or to move N and buy the rest.
- Press "Create transfer" on the suggestion.
- The transfer starts In transit: the origin warehouse loses the units at that moment.
- The units count as on the way for the destination warehouse (not the origin), so its signal does not ask for them again.
- When they arrive, record the arrival in Orders, "Transfers" tab.
Purchase orders with a destination
With several warehouses, the Purchasing Panel’s cart asks "Deliver to" and the manual order asks for a "Destination warehouse". When you record the arrival, the stock rises in that warehouse. When you import stock by CSV, rows go into the warehouse you are looking at, unless the file carries its own warehouse column.
The Analysis views
Money not moving
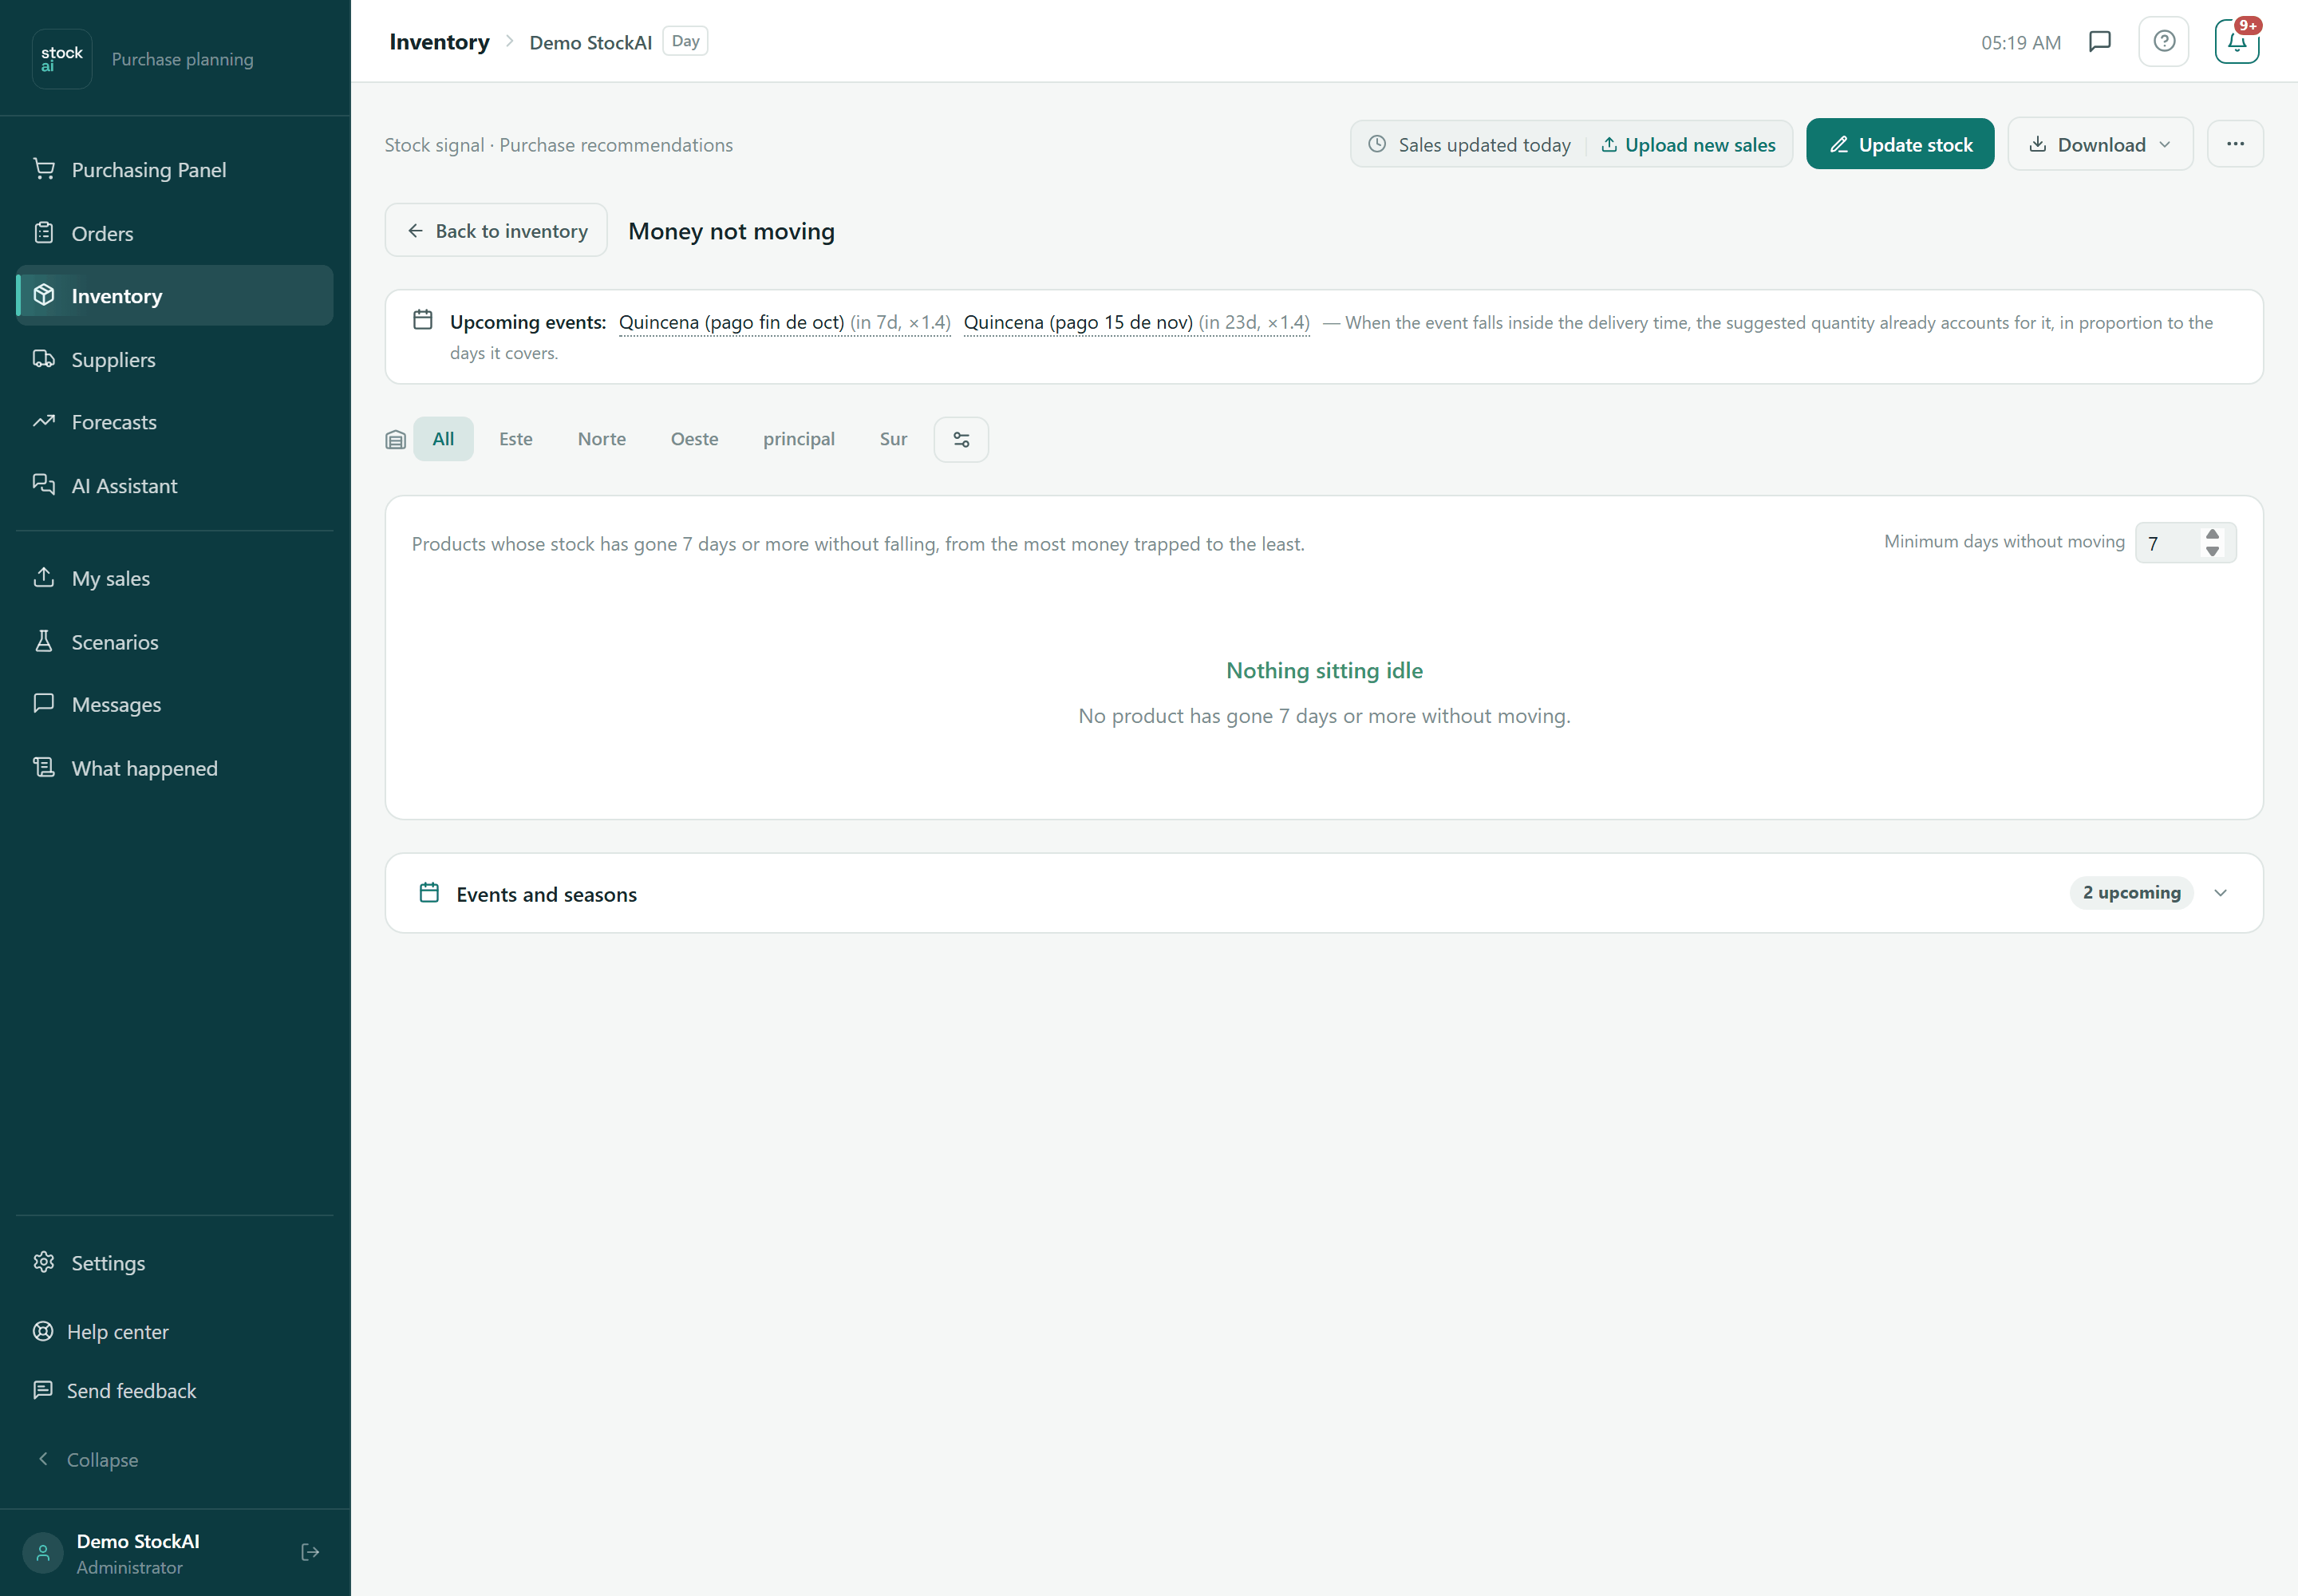
Products whose stock has not moved for at least the days you set in “Minimum days without moving” (7 to 365, 90 by default), from the most money trapped to the least. It needs no forecast: it reads your stock's real history. On top: the total in money, how many products and how many have no cost (left out of the total). Columns: Product, Days still, Stock, Value, Category and Status. Below, how many products were left out for lack of history or for having moved recently.
Rising costs
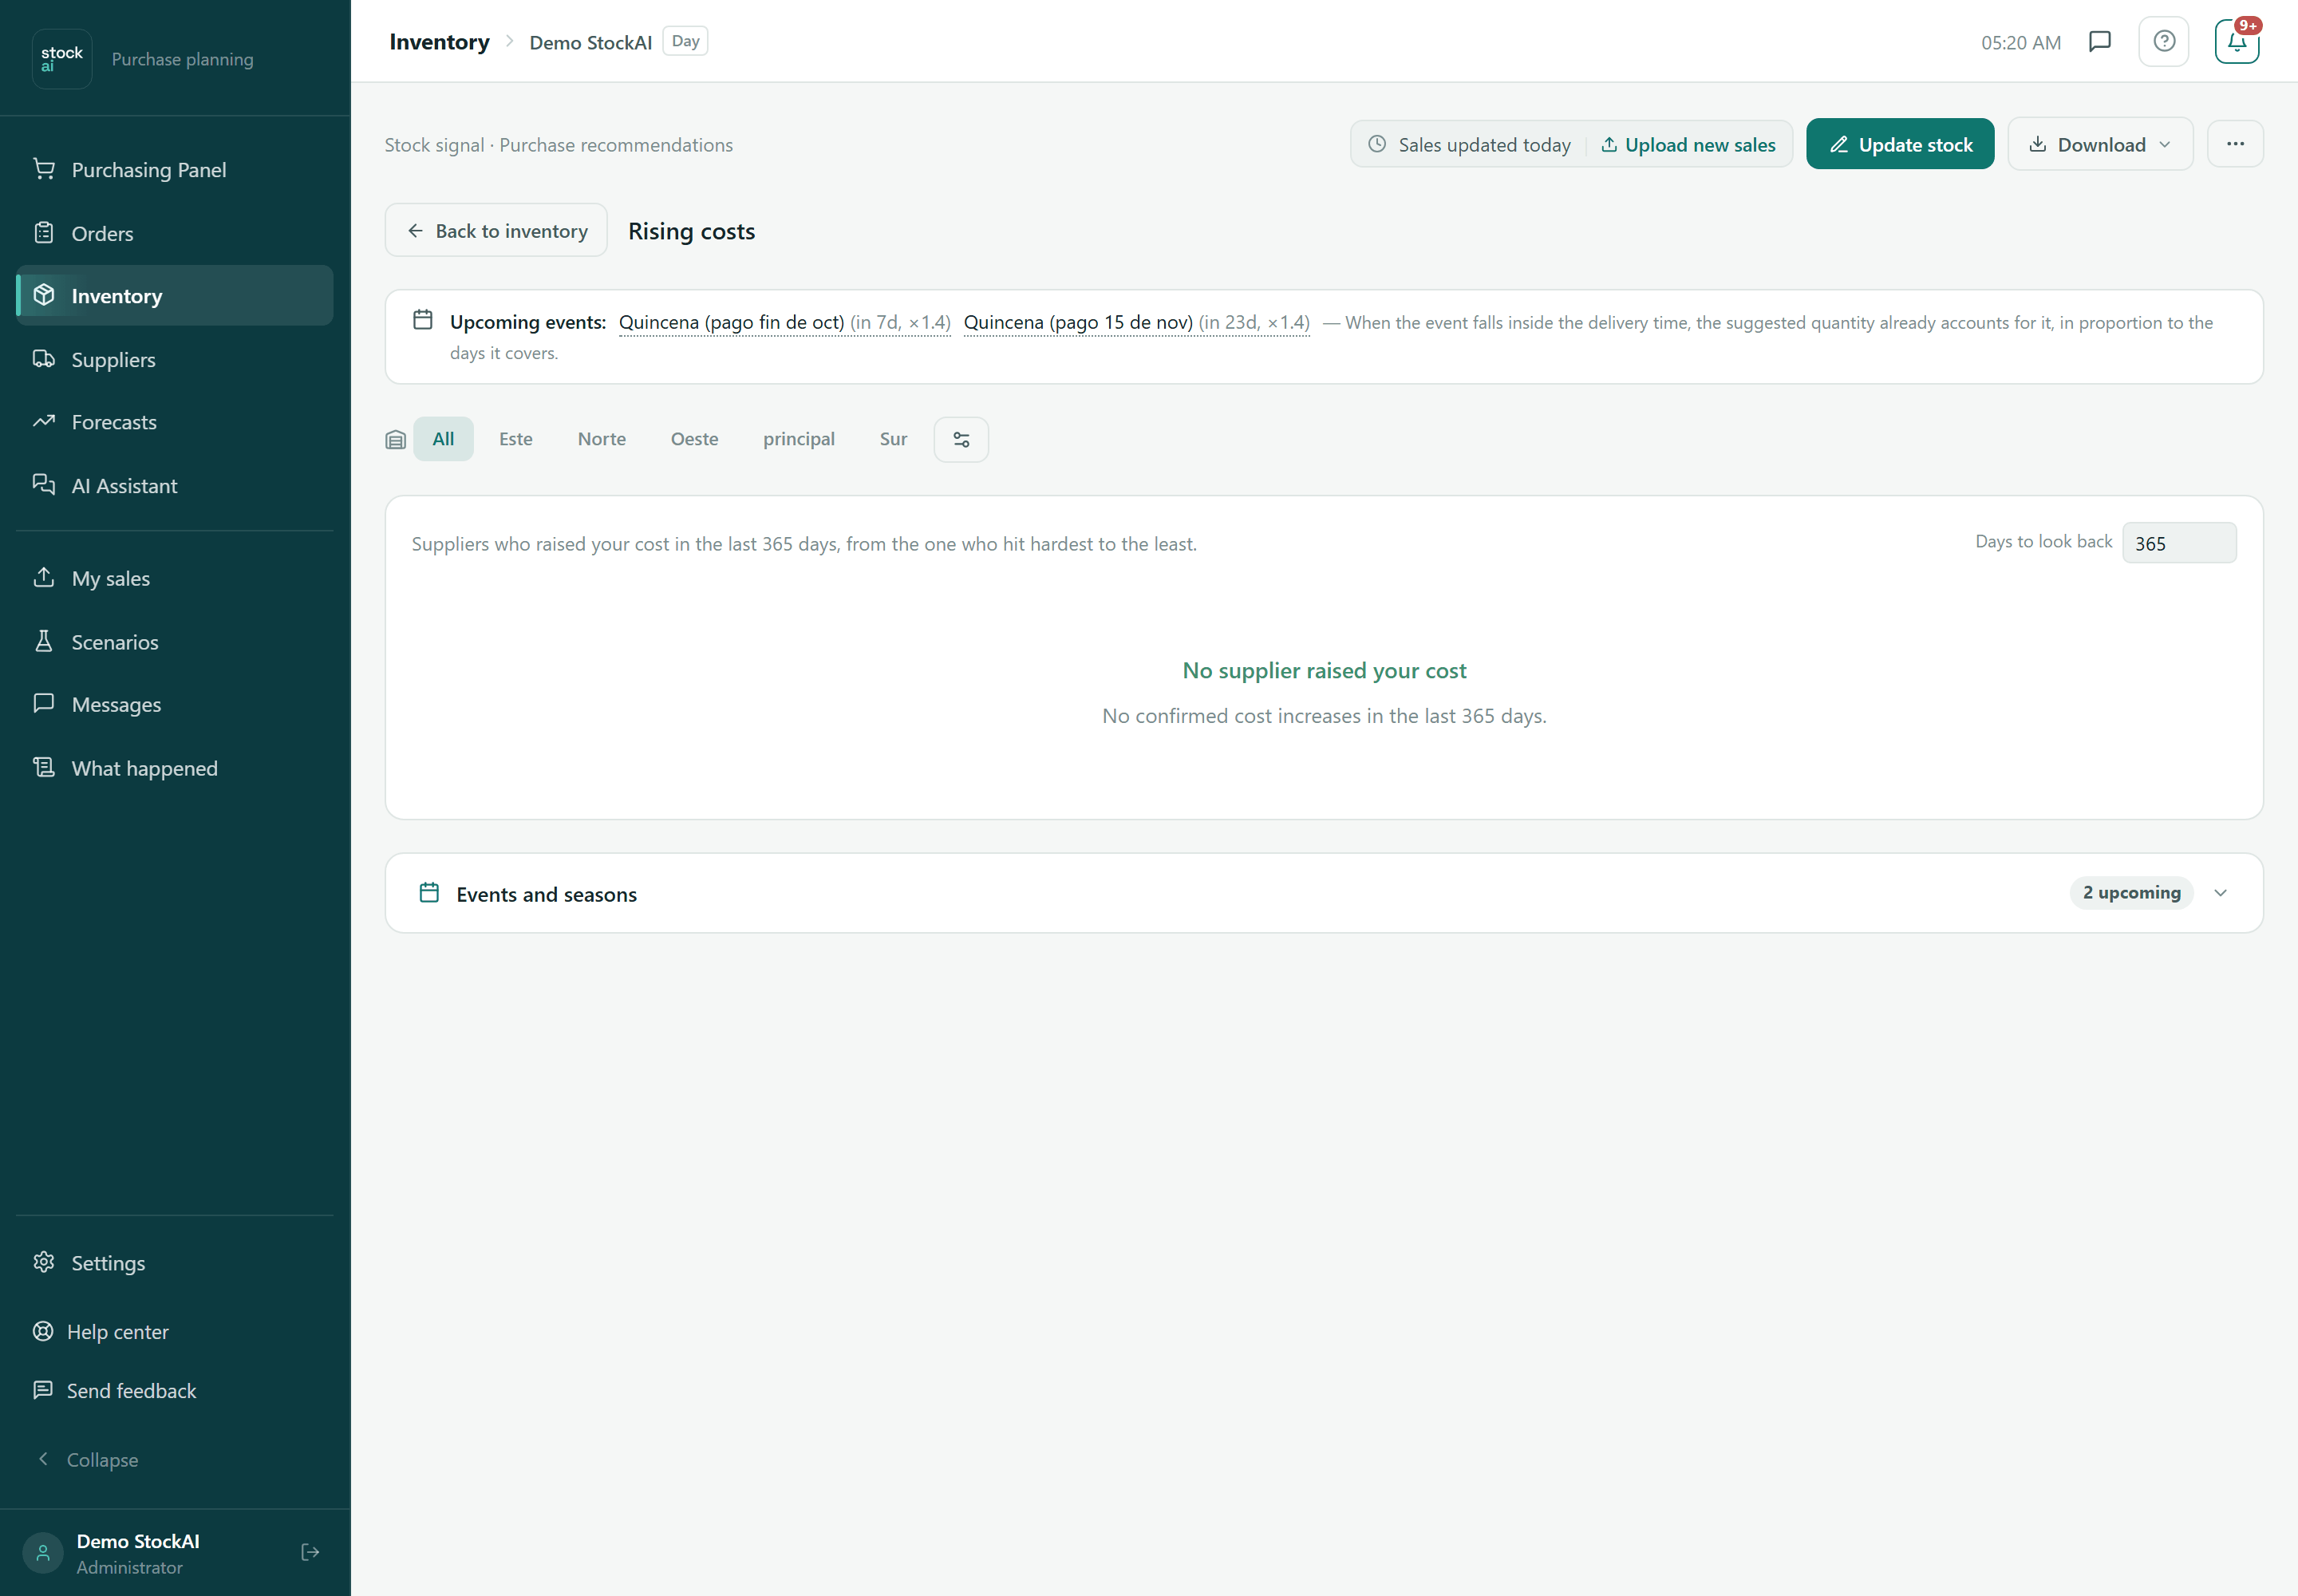
Suppliers who raised your cost over the last “Days to look back” (365 by default), from the one who hit hardest to the least: Supplier, Times raised, Cumulative rise and Hardest-hit products (“from X to Y (Z%)”). Only costs from orders that actually arrived count.
Shrinking margin
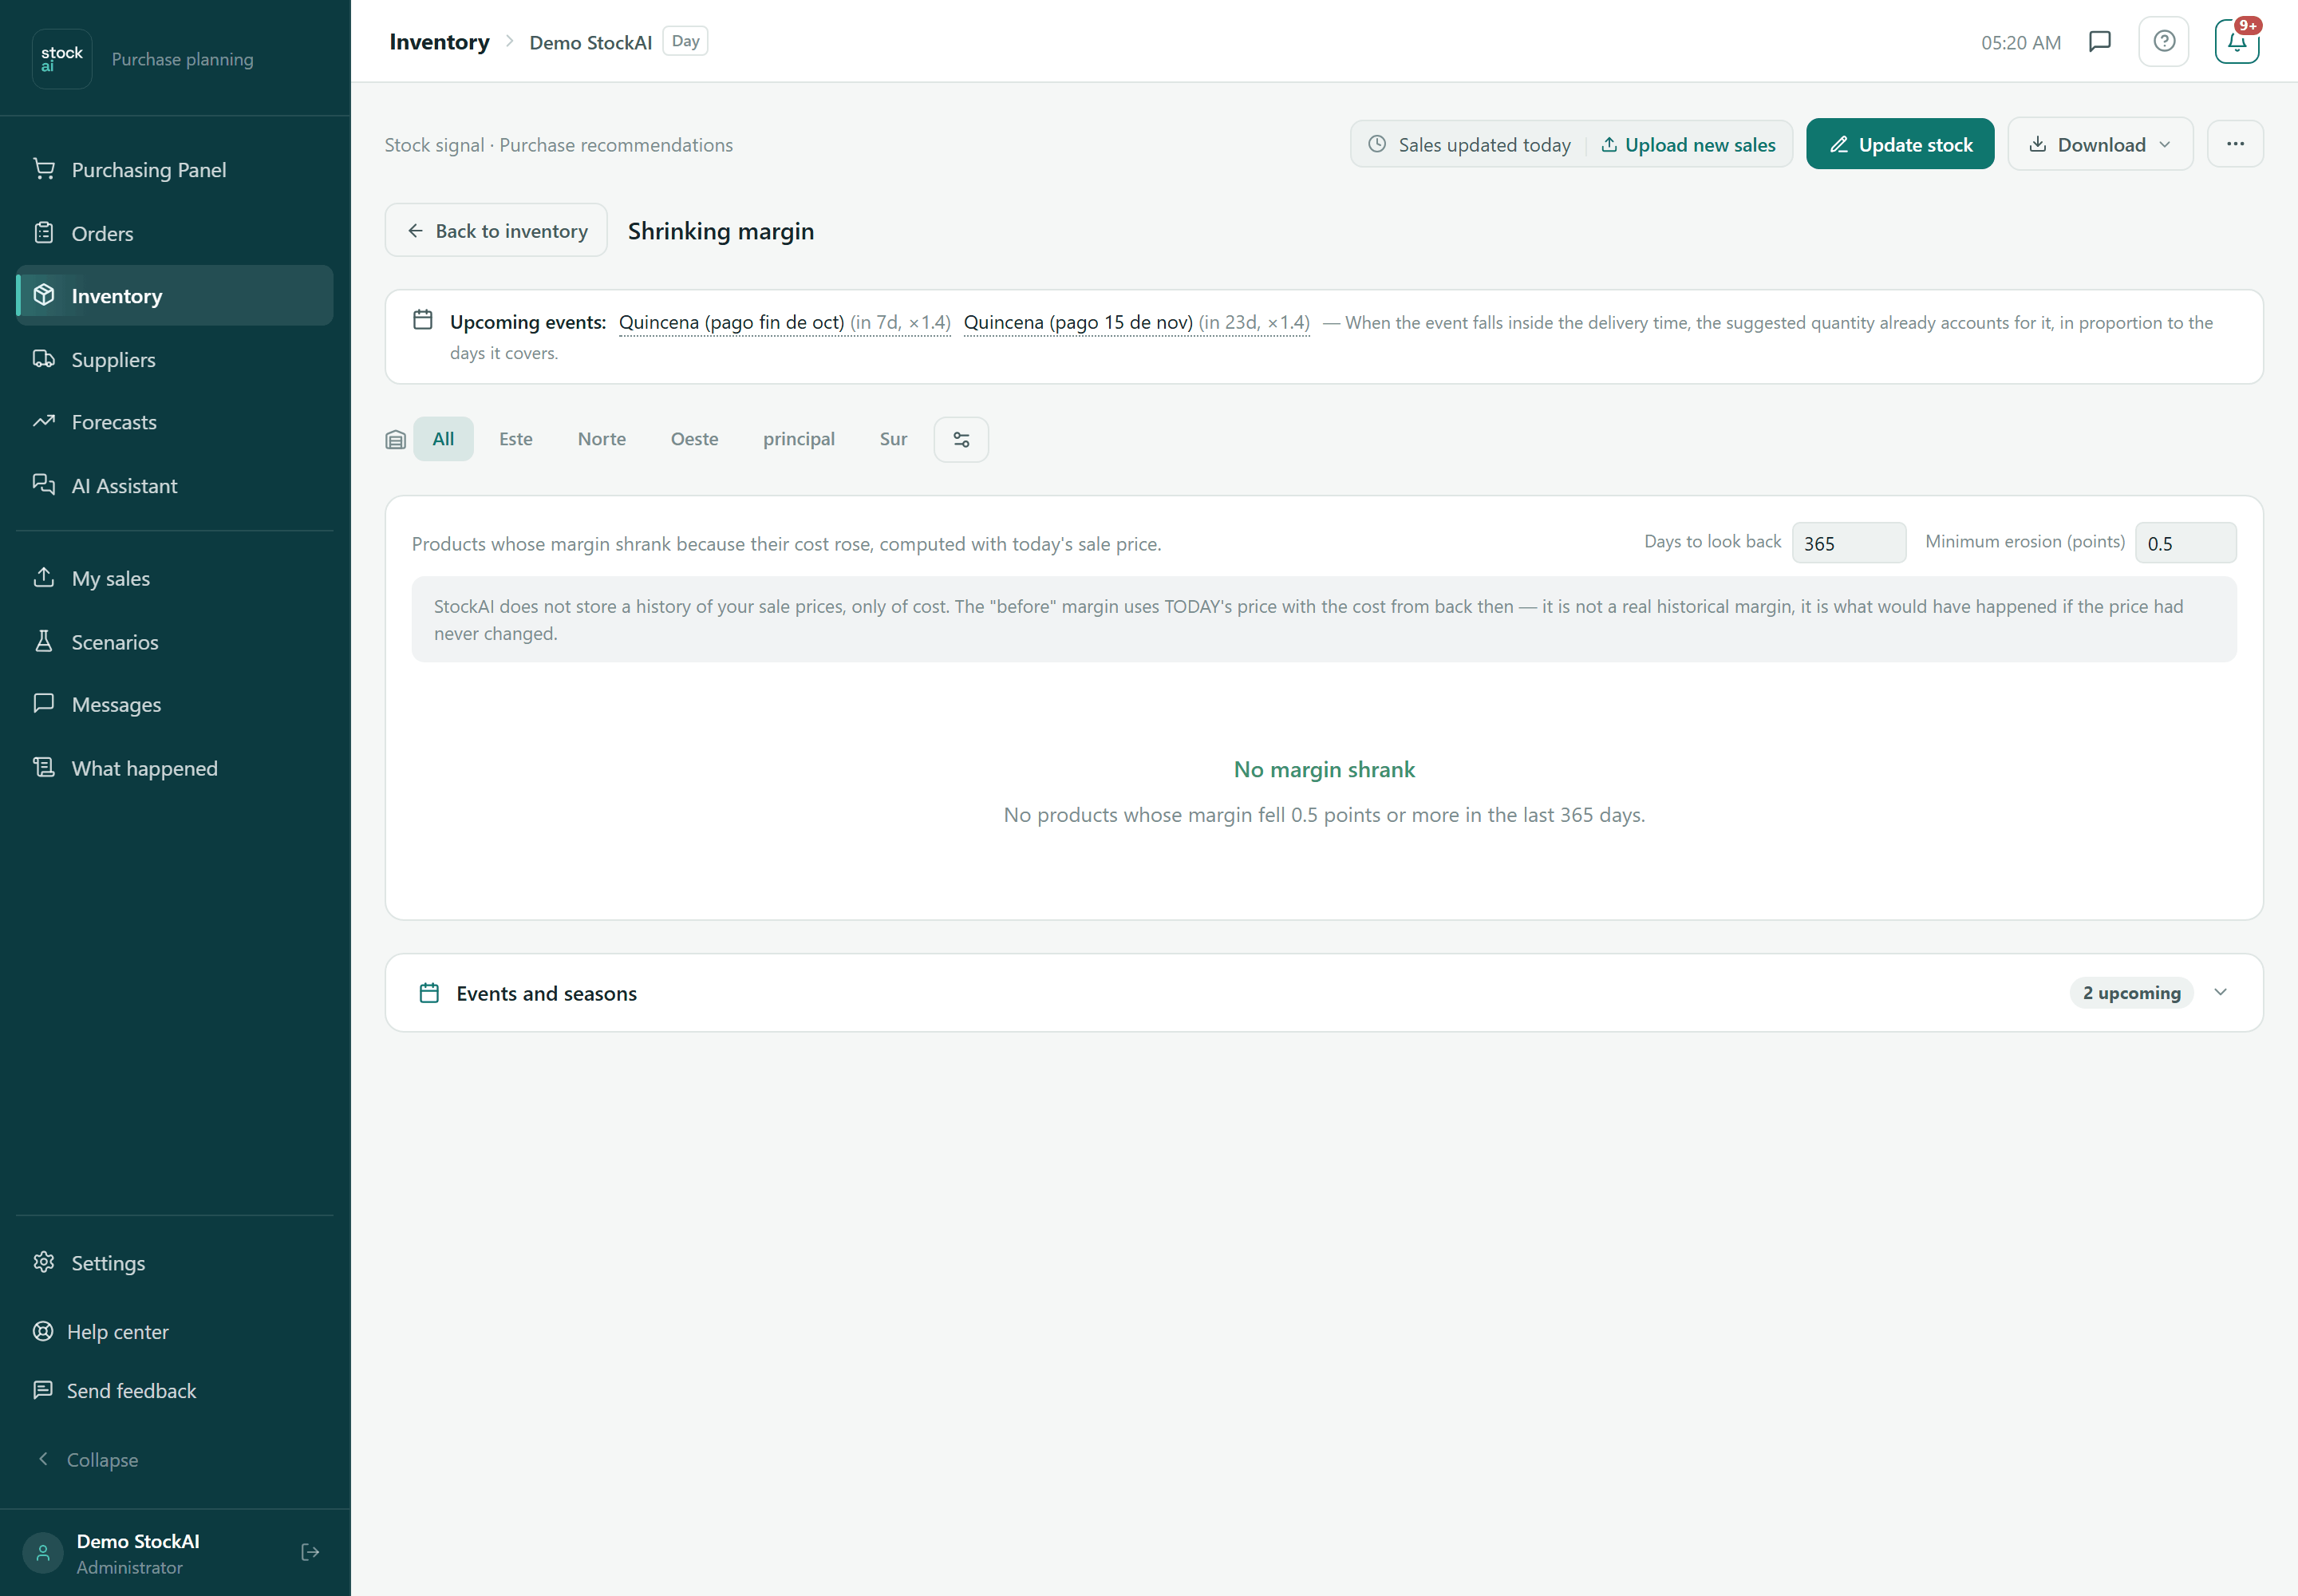
Products whose margin shrank because their cost rose, with “Days to look back” and “Minimum erosion (points)” (0.5 by default). Columns: Cost before, Cost now, Margin before (estimated), Margin now and Points lost; “You are selling below cost” when the margin is negative. Since StockAI does not store your sale price history, the “before” margin uses today's price with the cost from back then.
Forecast in money
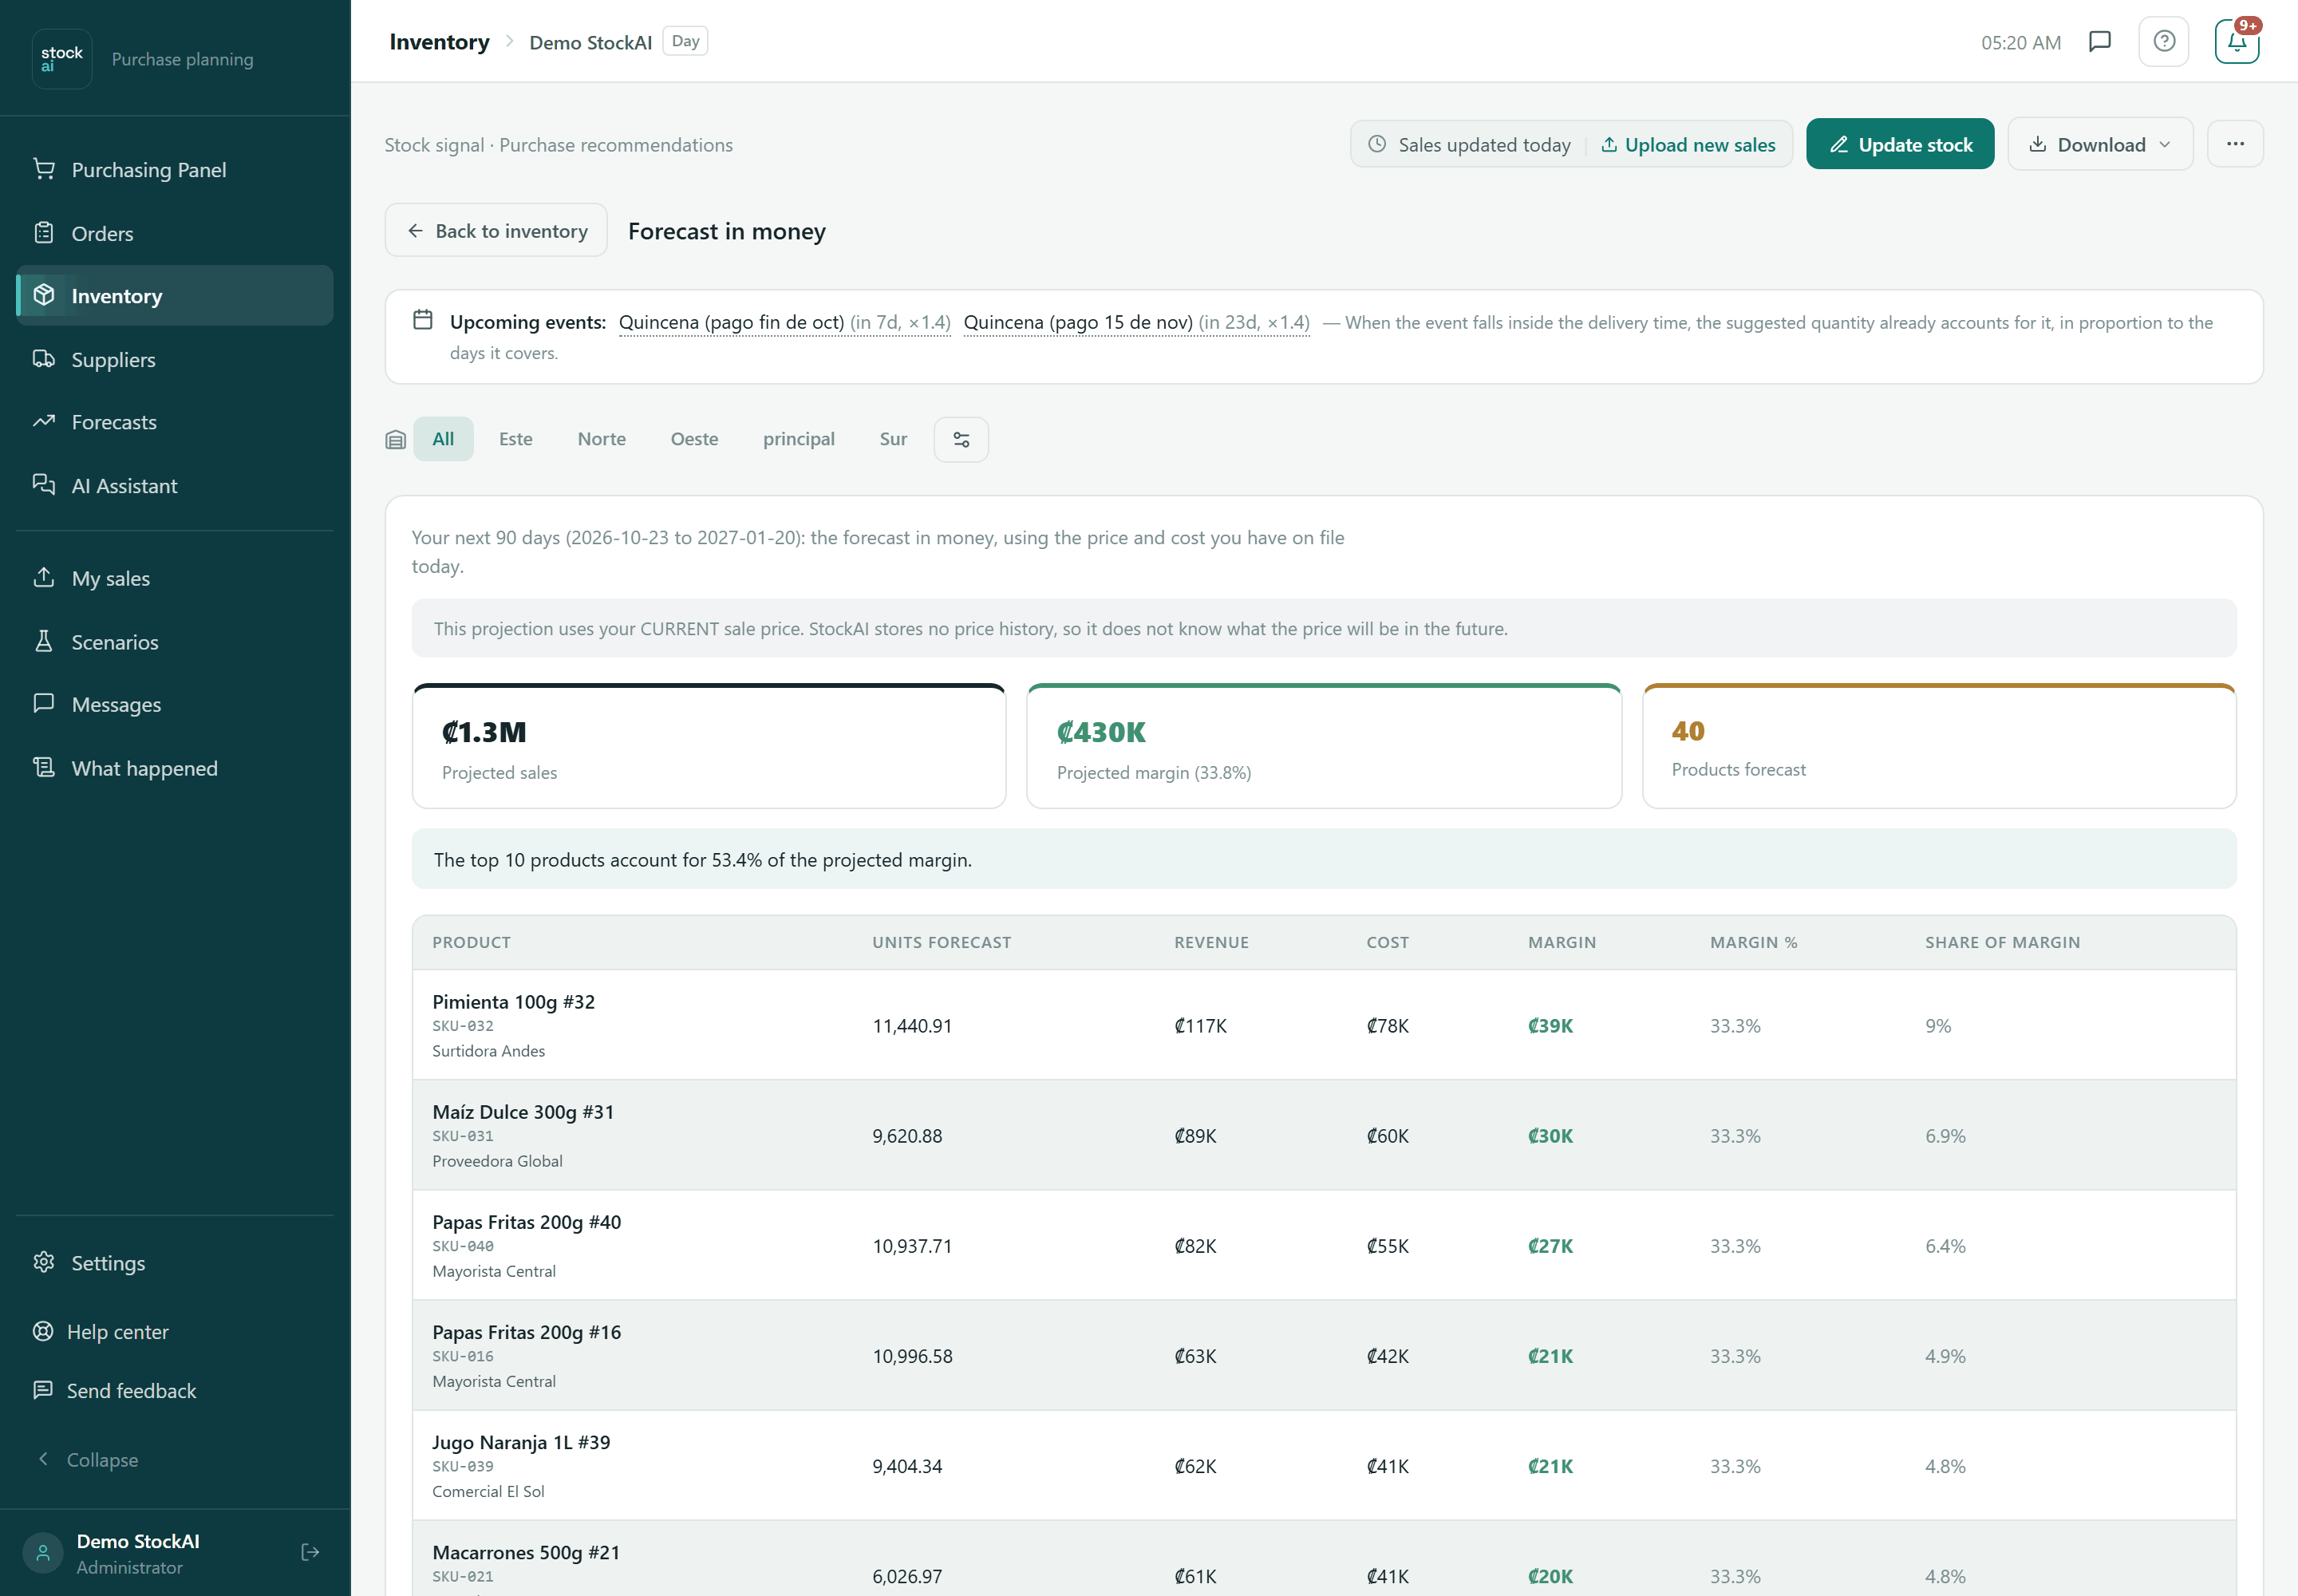
Your coming days in money, with the price and cost on file today: Projected sales, Projected margin and Products forecast, and per product Units forecast, Revenue, Cost, Margin, Margin % and Share of margin. Products with no price or no cost show as “Unknown” and are left out of the totals. It needs a finished forecast.
Cost of ignoring
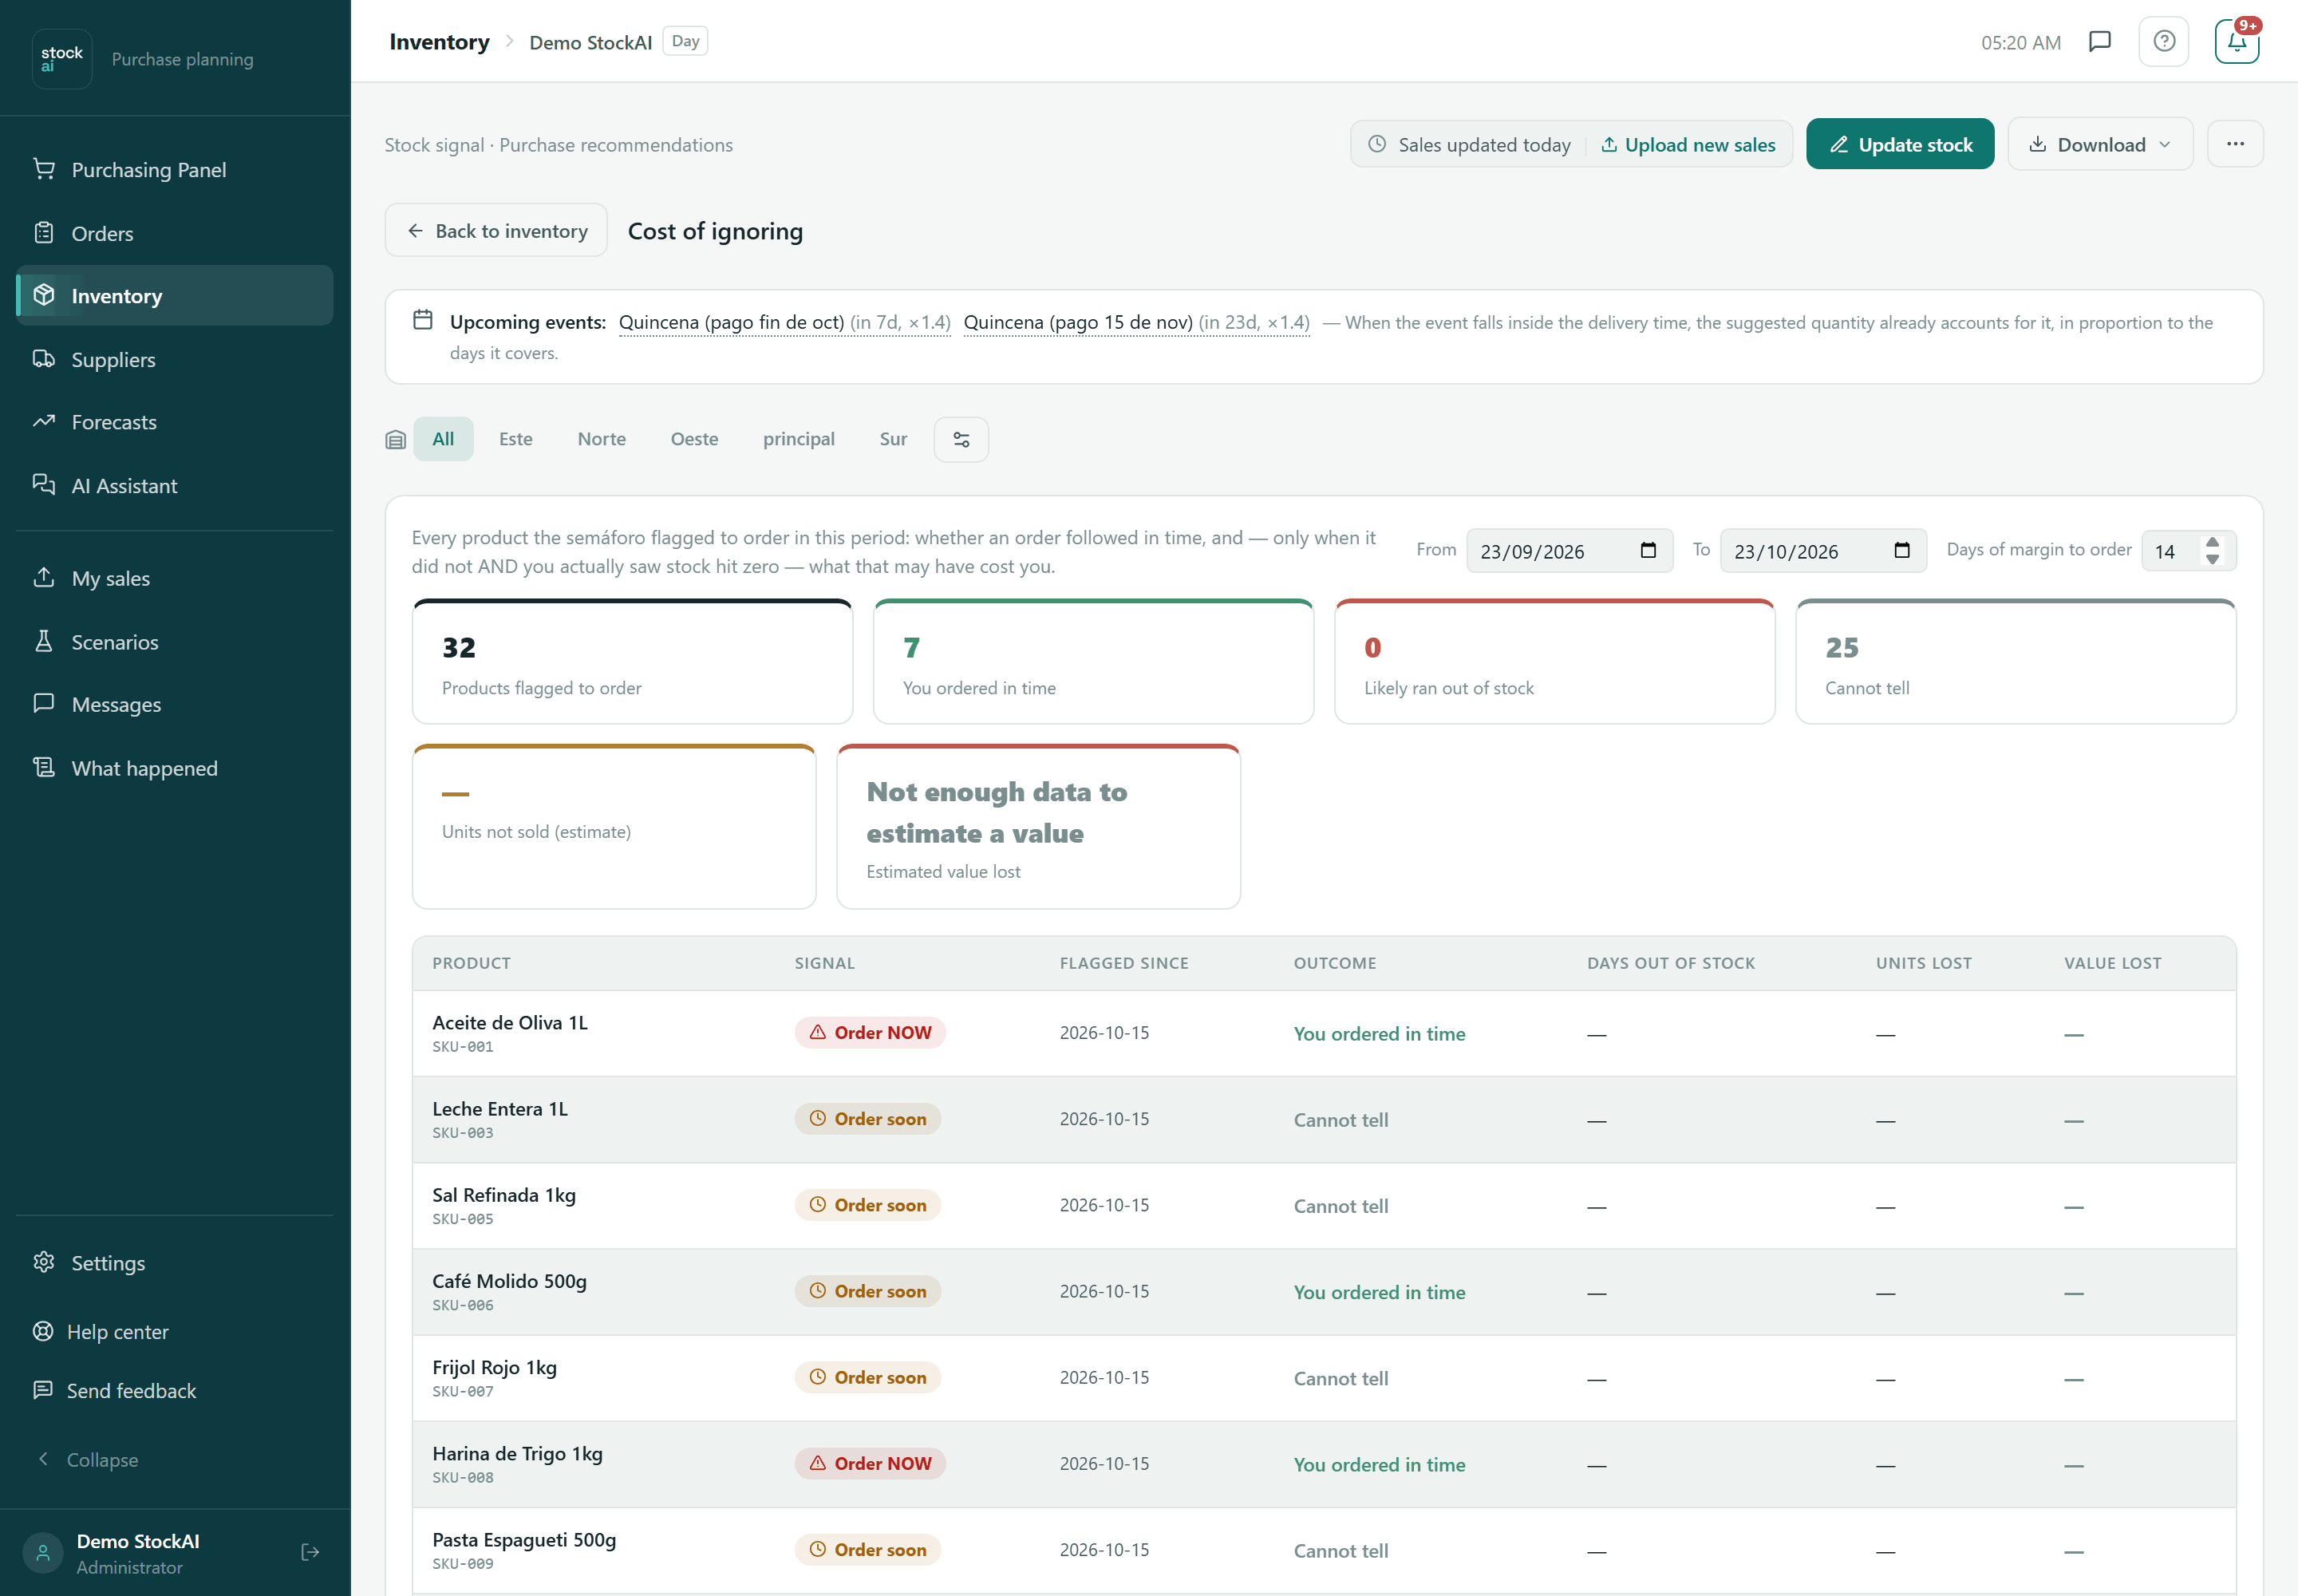
Every product the signal flagged to order between From and To, and whether an order followed within “Days of margin to order” (14 by default). Outcome per product: You ordered in time, Likely stockout (no order, and stock was seen at zero: with days out of stock and estimated units and value lost) or Cannot tell (no order, but stock was never seen at zero).
Committed demand
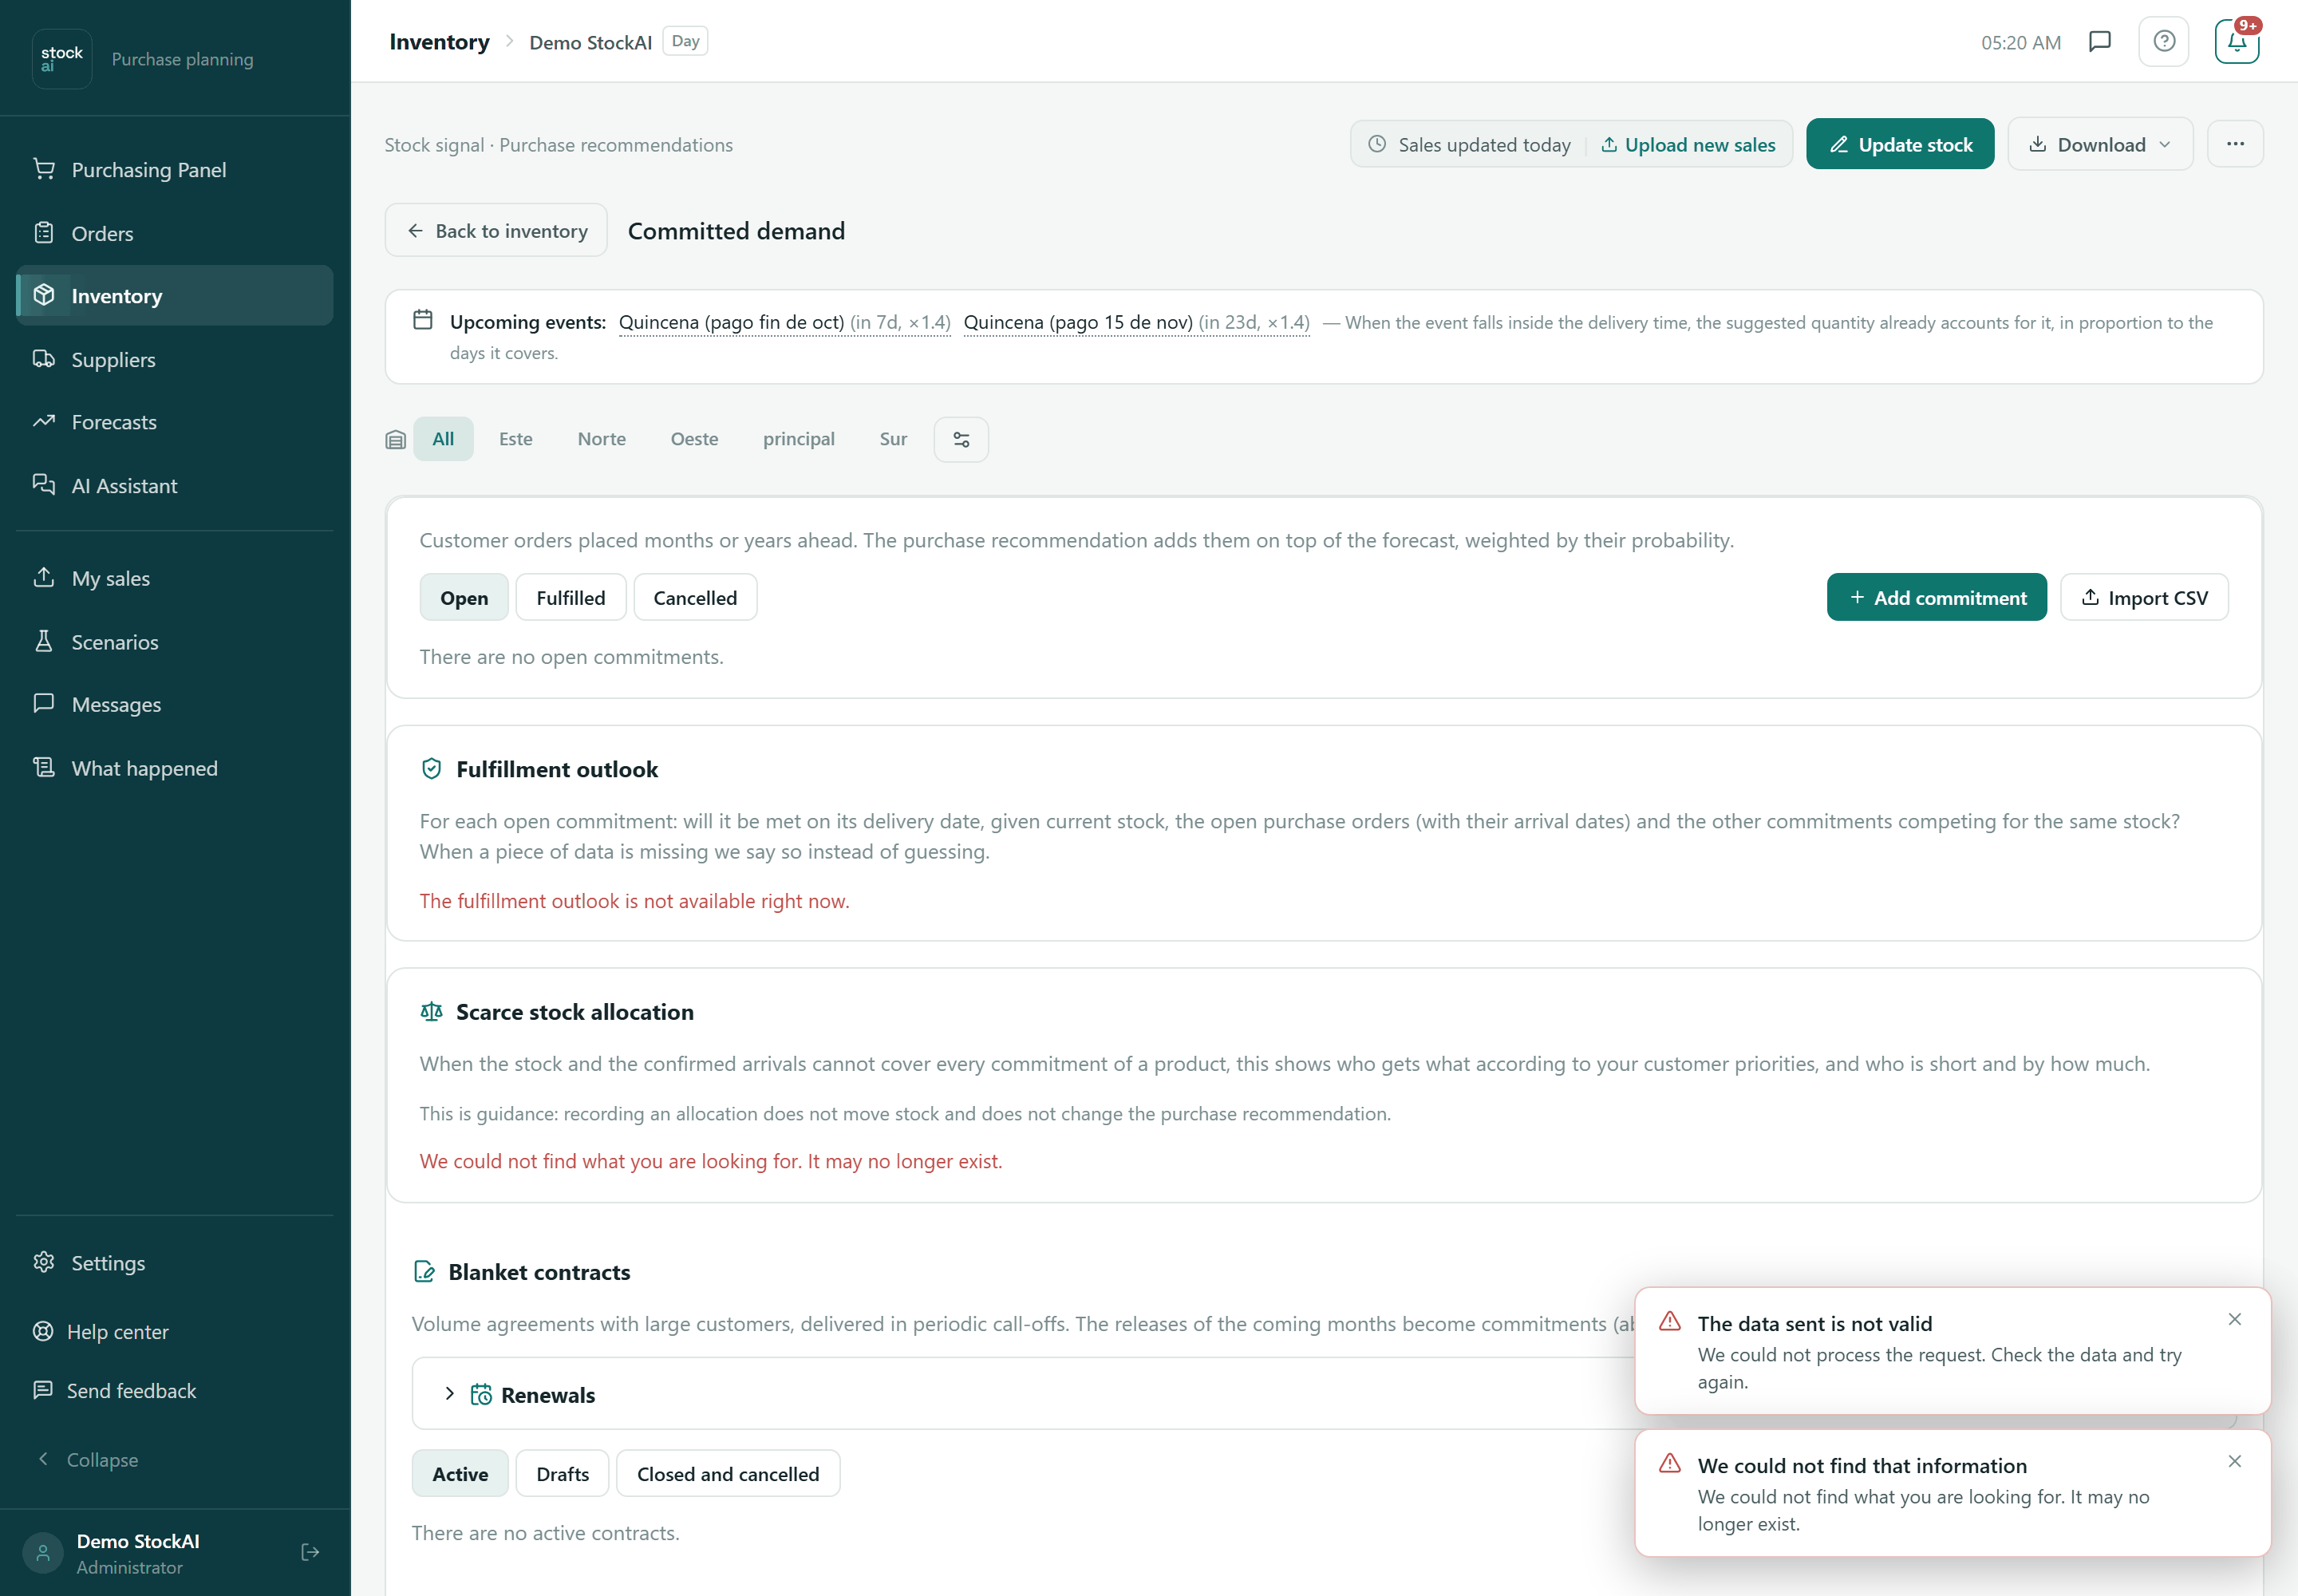
For customers who order months or years ahead. It brings seven panels together; everything you record here is added to the purchase recommendation, weighted by its probability:
- Committed demand
- Customer orders with Product (SKU), Delivery date, Quantity, Customer, Probability (%), Warehouse (optional) and Note. “Add commitment” or “Import CSV” (columns sku, delivery date, quantity, customer, probability, warehouse, note; all or nothing). Each commitment can be Mark fulfilled, Cancel or Reopen, and says whether it is covered or at risk and when to order by.
- Fulfillment outlook
- For each open commitment: whether it will be met on its date given stock, open orders and the other commitments competing for the same stock, and the money at risk by customer and by contract.
- Scarce stock allocation
- When stock cannot cover everyone, who gets what according to customer priority (1 first, 9 last). Calculate, What if (change priorities or add a hypothetical order without saving), “Record reservations” and “Release reservations”. It is guidance: it moves no stock and does not change the recommendation.
- Blanket contracts
- Volume agreements with periodic releases: customer, contract number, warehouse, period, release schedule (paste the table from a spreadsheet), tolerance, price, notice period and renewal alerts. “Save and activate”, “Save as draft”, Revise, Close or Cancel. The coming months' releases become commitments.
- Customer portal
- A private link where a corporate customer sees only their own commitments (never stock, costs or other customers). Choose the customer, the language, whether it shows the dates you promise and how long it is valid, then press “Create link”. The link is shown only once: copy it. You can Revoke or Reopen it.
- Recurring deliveries
- “N units every week or month, from one date to another”, with weekday or day of the month, what to do on a holiday and the customer's holidays. “Save and create commitments”, Change, Pause (withdraws the future commitments) and Resume.
- Forecast by analogy
- For a new product with no history: say which products it will resemble (up to 5), a Factor from 0.1 to 10 and the launch date. Their forecast is used until the product has data of its own. Undo returns it to “No data”.
Events and seasons
At the bottom, the folding “Events and seasons” panel records high seasons so the system warns you in advance. It has two tabs:
- My events
- “Add event or season”: name, Start date, End date, Demand multiplier (mild to peak) and notes, then “Save event”. Each event has Simulate (what would happen to your stock: how many extra units to order and by when) and Delete event. Past events are hidden.
- LatAm calendar
- Commercial events StockAI already knows. Pick the Country:, press “Load calendar” and switch each event on or off. “Refresh calendar (add next year)” adds the following year.
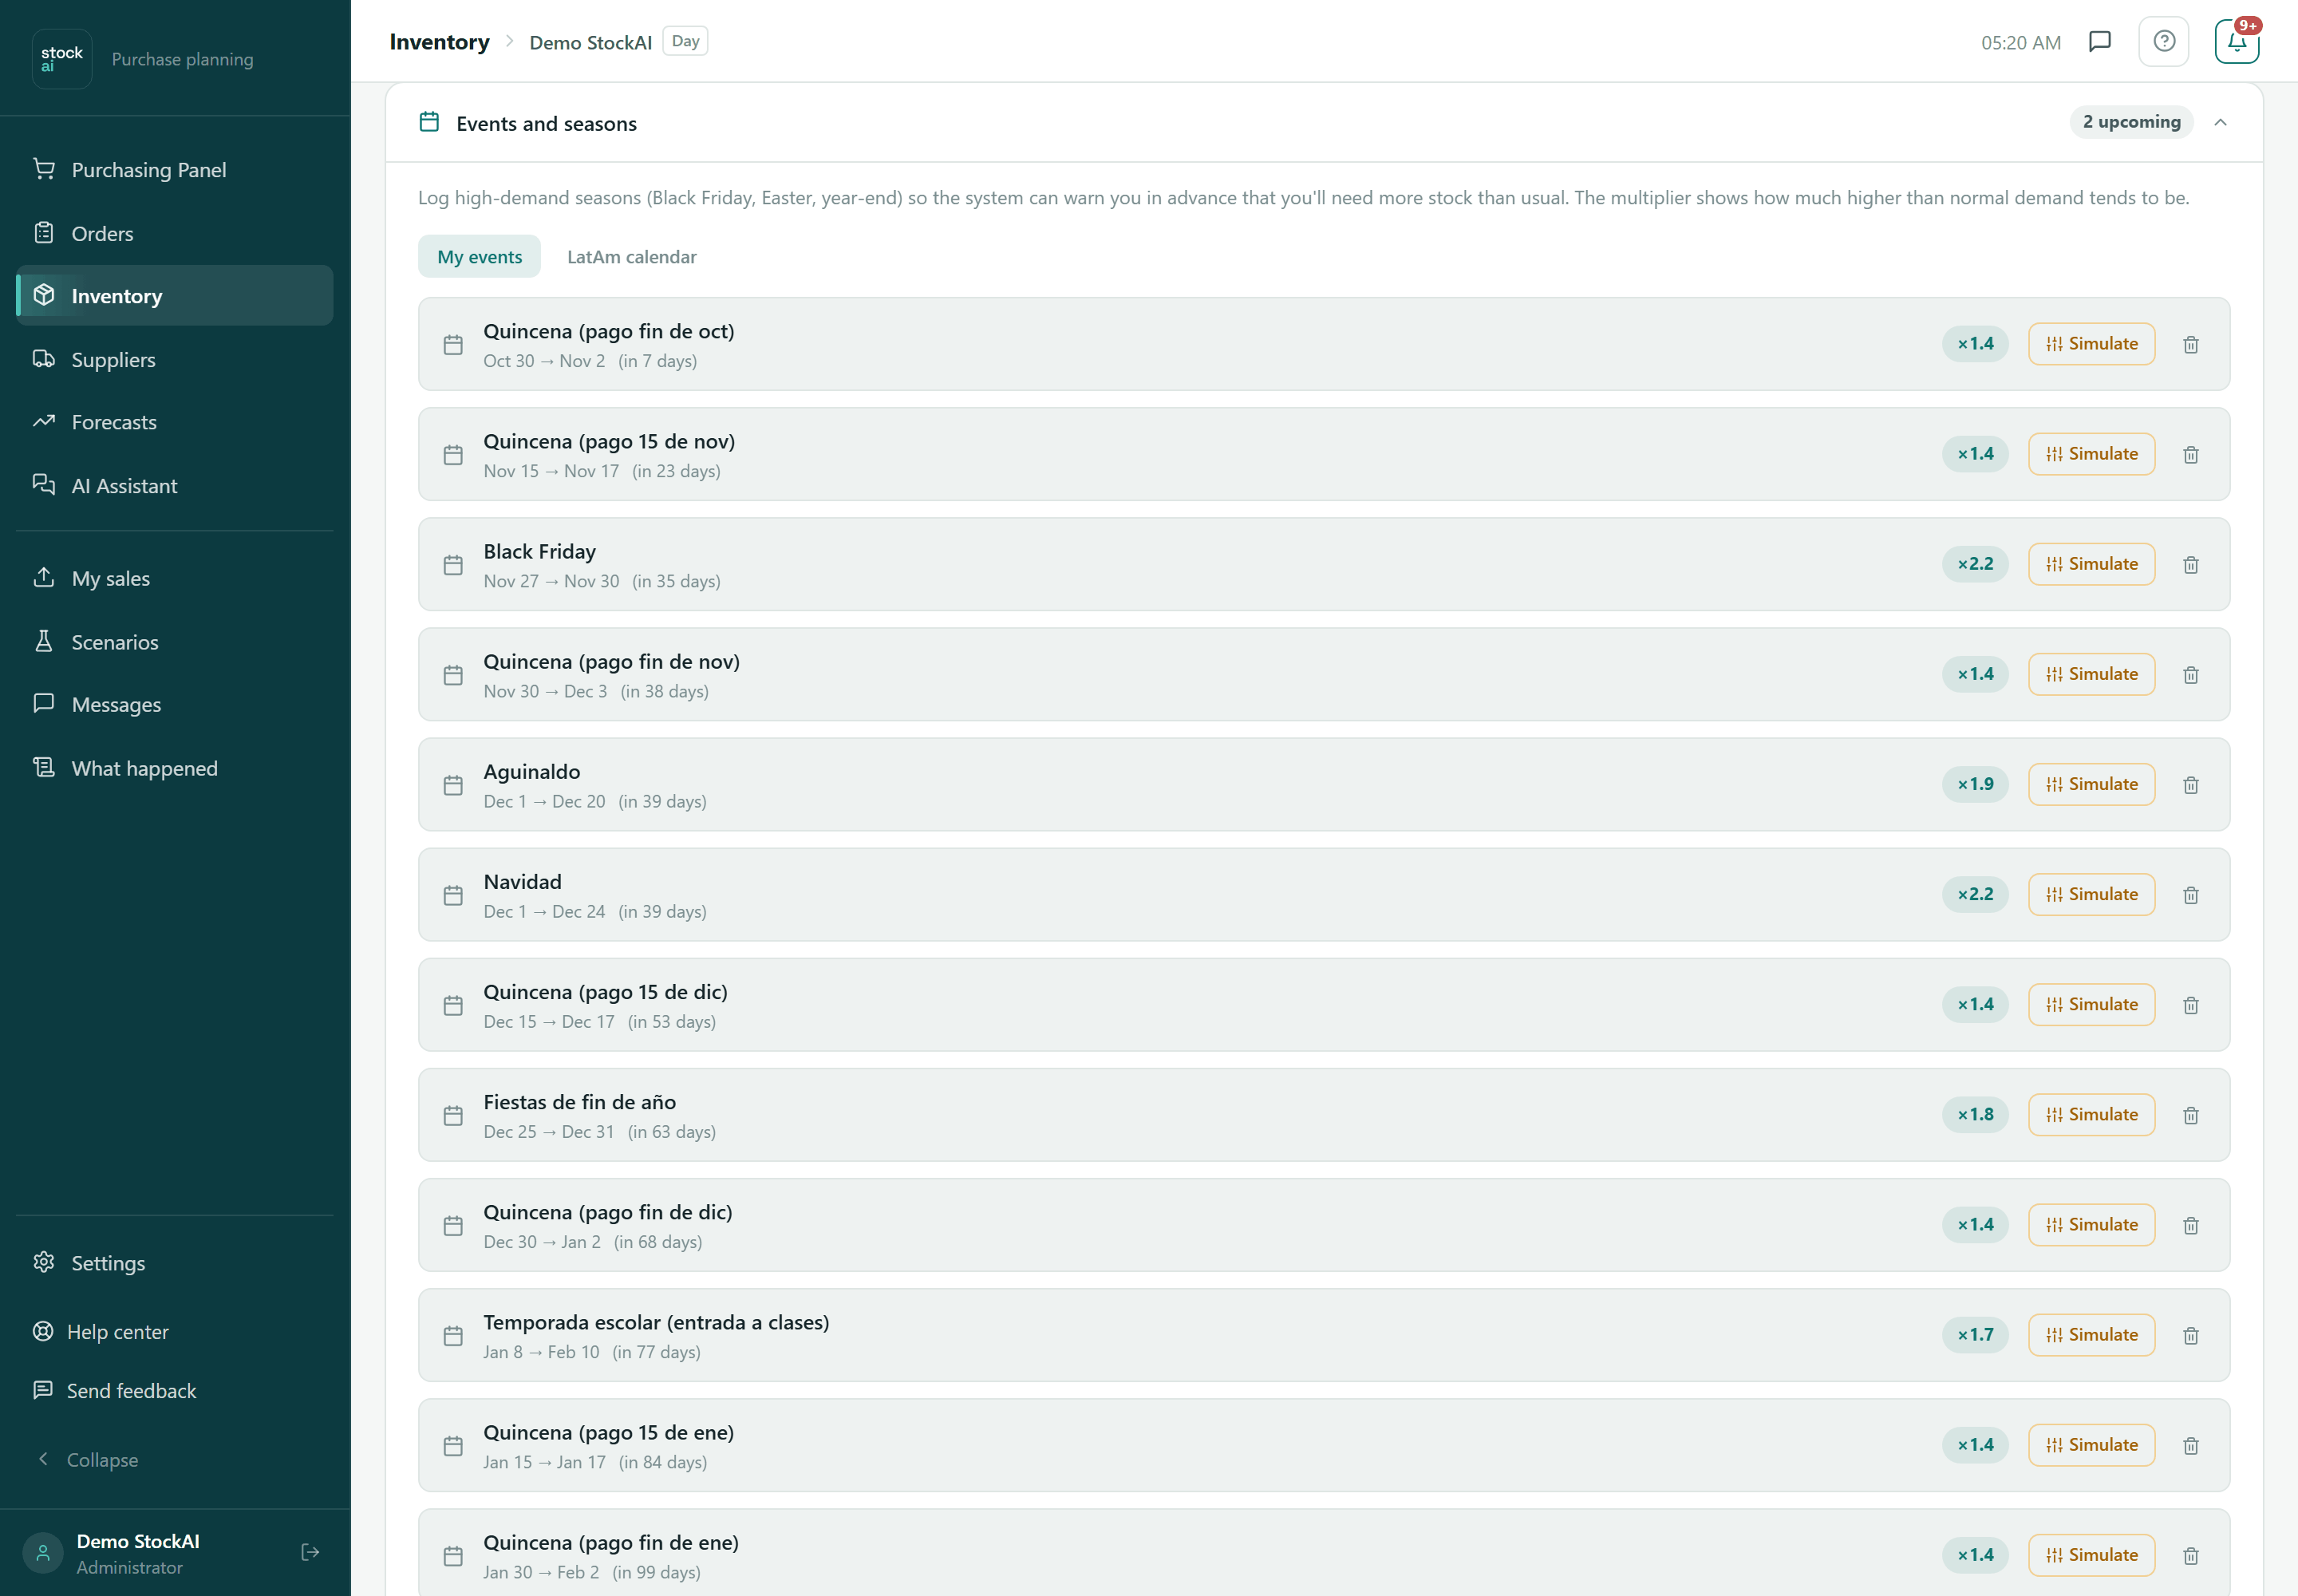
When an event falls inside the delivery time, the suggested quantity already accounts for it, in proportion to the days it covers.
What each status means
At the very bottom, “What each status means” opens the signal legend with your company's rules (for example “less than 0.5 times the supplier's lead time”) and the “Adjust the stock signal rules” link, which takes you to Set up inventory.

When the screen is empty
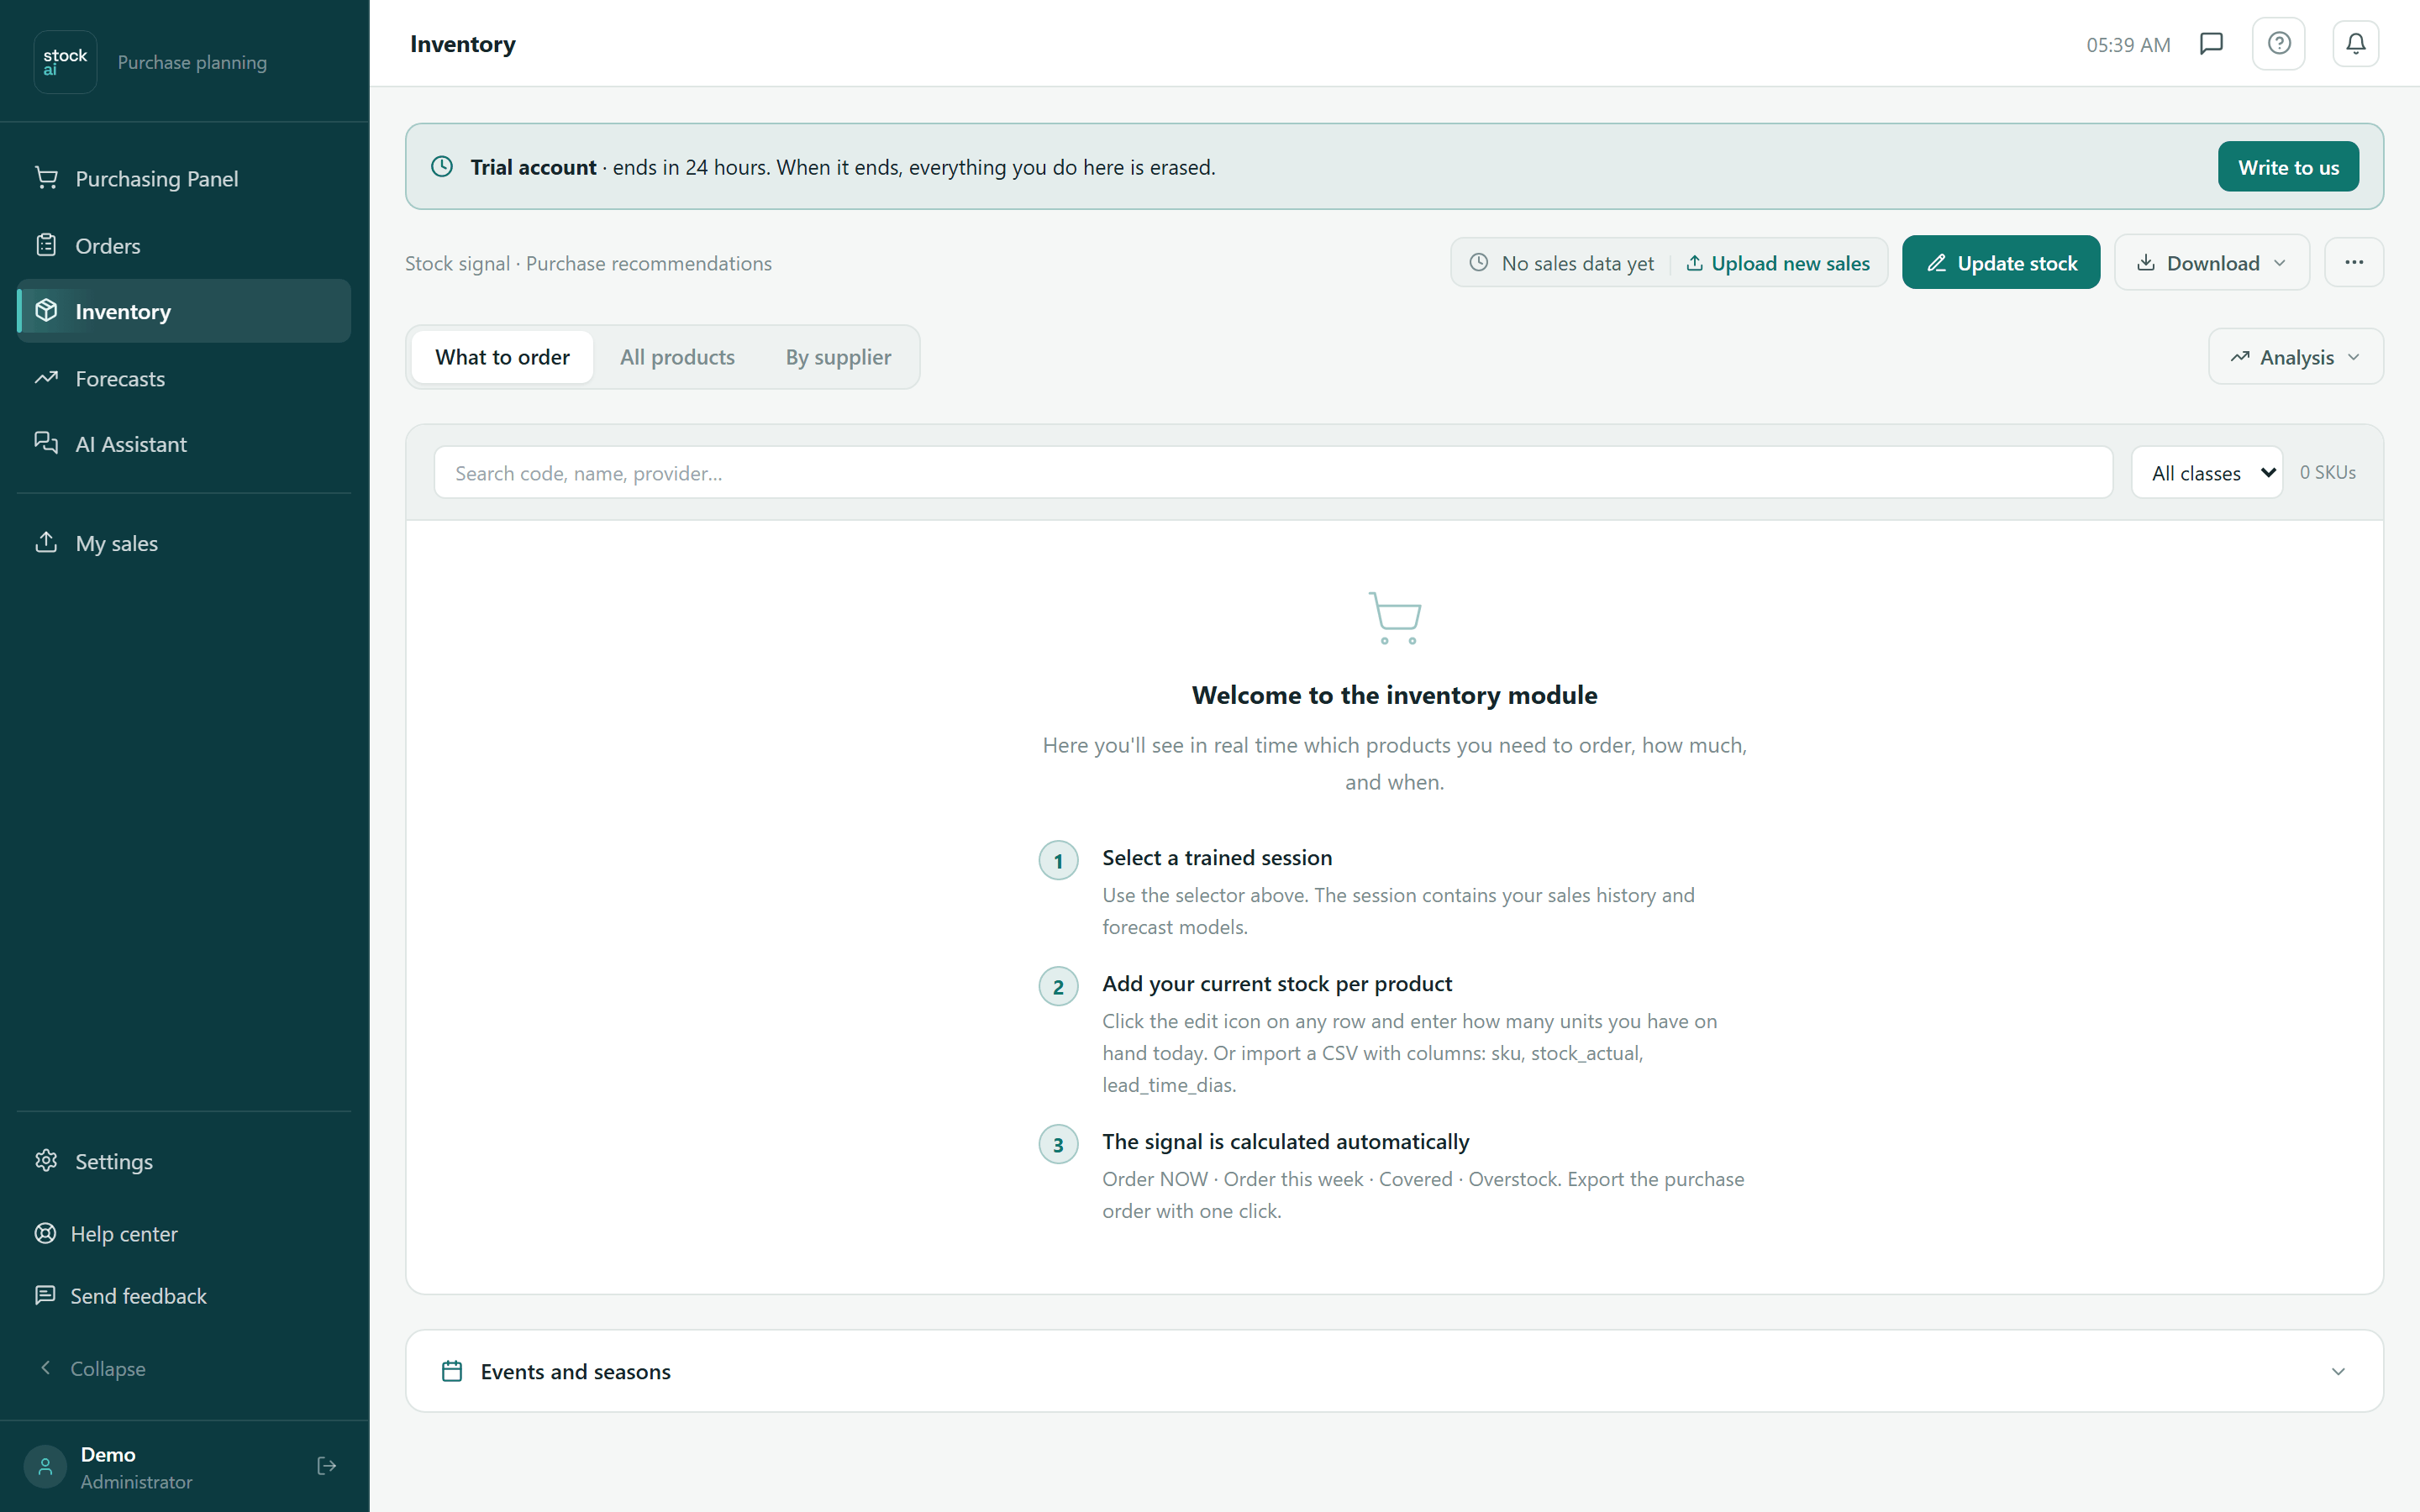
- “Welcome to the inventory module”: there is no finished forecast and no stock. Upload your sales in My sales and load your stock.
- Notice “You do not have a finished projection yet…”: you see your products' stock with the “No data” signal and no suggested quantity. “Upload sales” takes you to load the history.
- “No product has stock loaded”: there is a forecast but no stock. “Upload current stock” opens the quick editor.
- “No data in this warehouse”: the chosen warehouse has no stock and no assigned demand for the active forecast.
Continue with Stock count, Set up inventory and Inventory sync.