Upload sales and calculate the forecast
The three-step wizard that turns your sales history into forecasts: upload the file (or reuse one), confirm which column is which, and StockAI trains the models and takes you to the result.
On this page
Upload sales is where every forecast starts. It shares a tab strip with Data sources. At the top, the step bar: 1. Upload your sales, 2. Confirm columns and 3. The system learns. When it finishes, the app opens Forecasts on the new run, which becomes the one the app plans from.
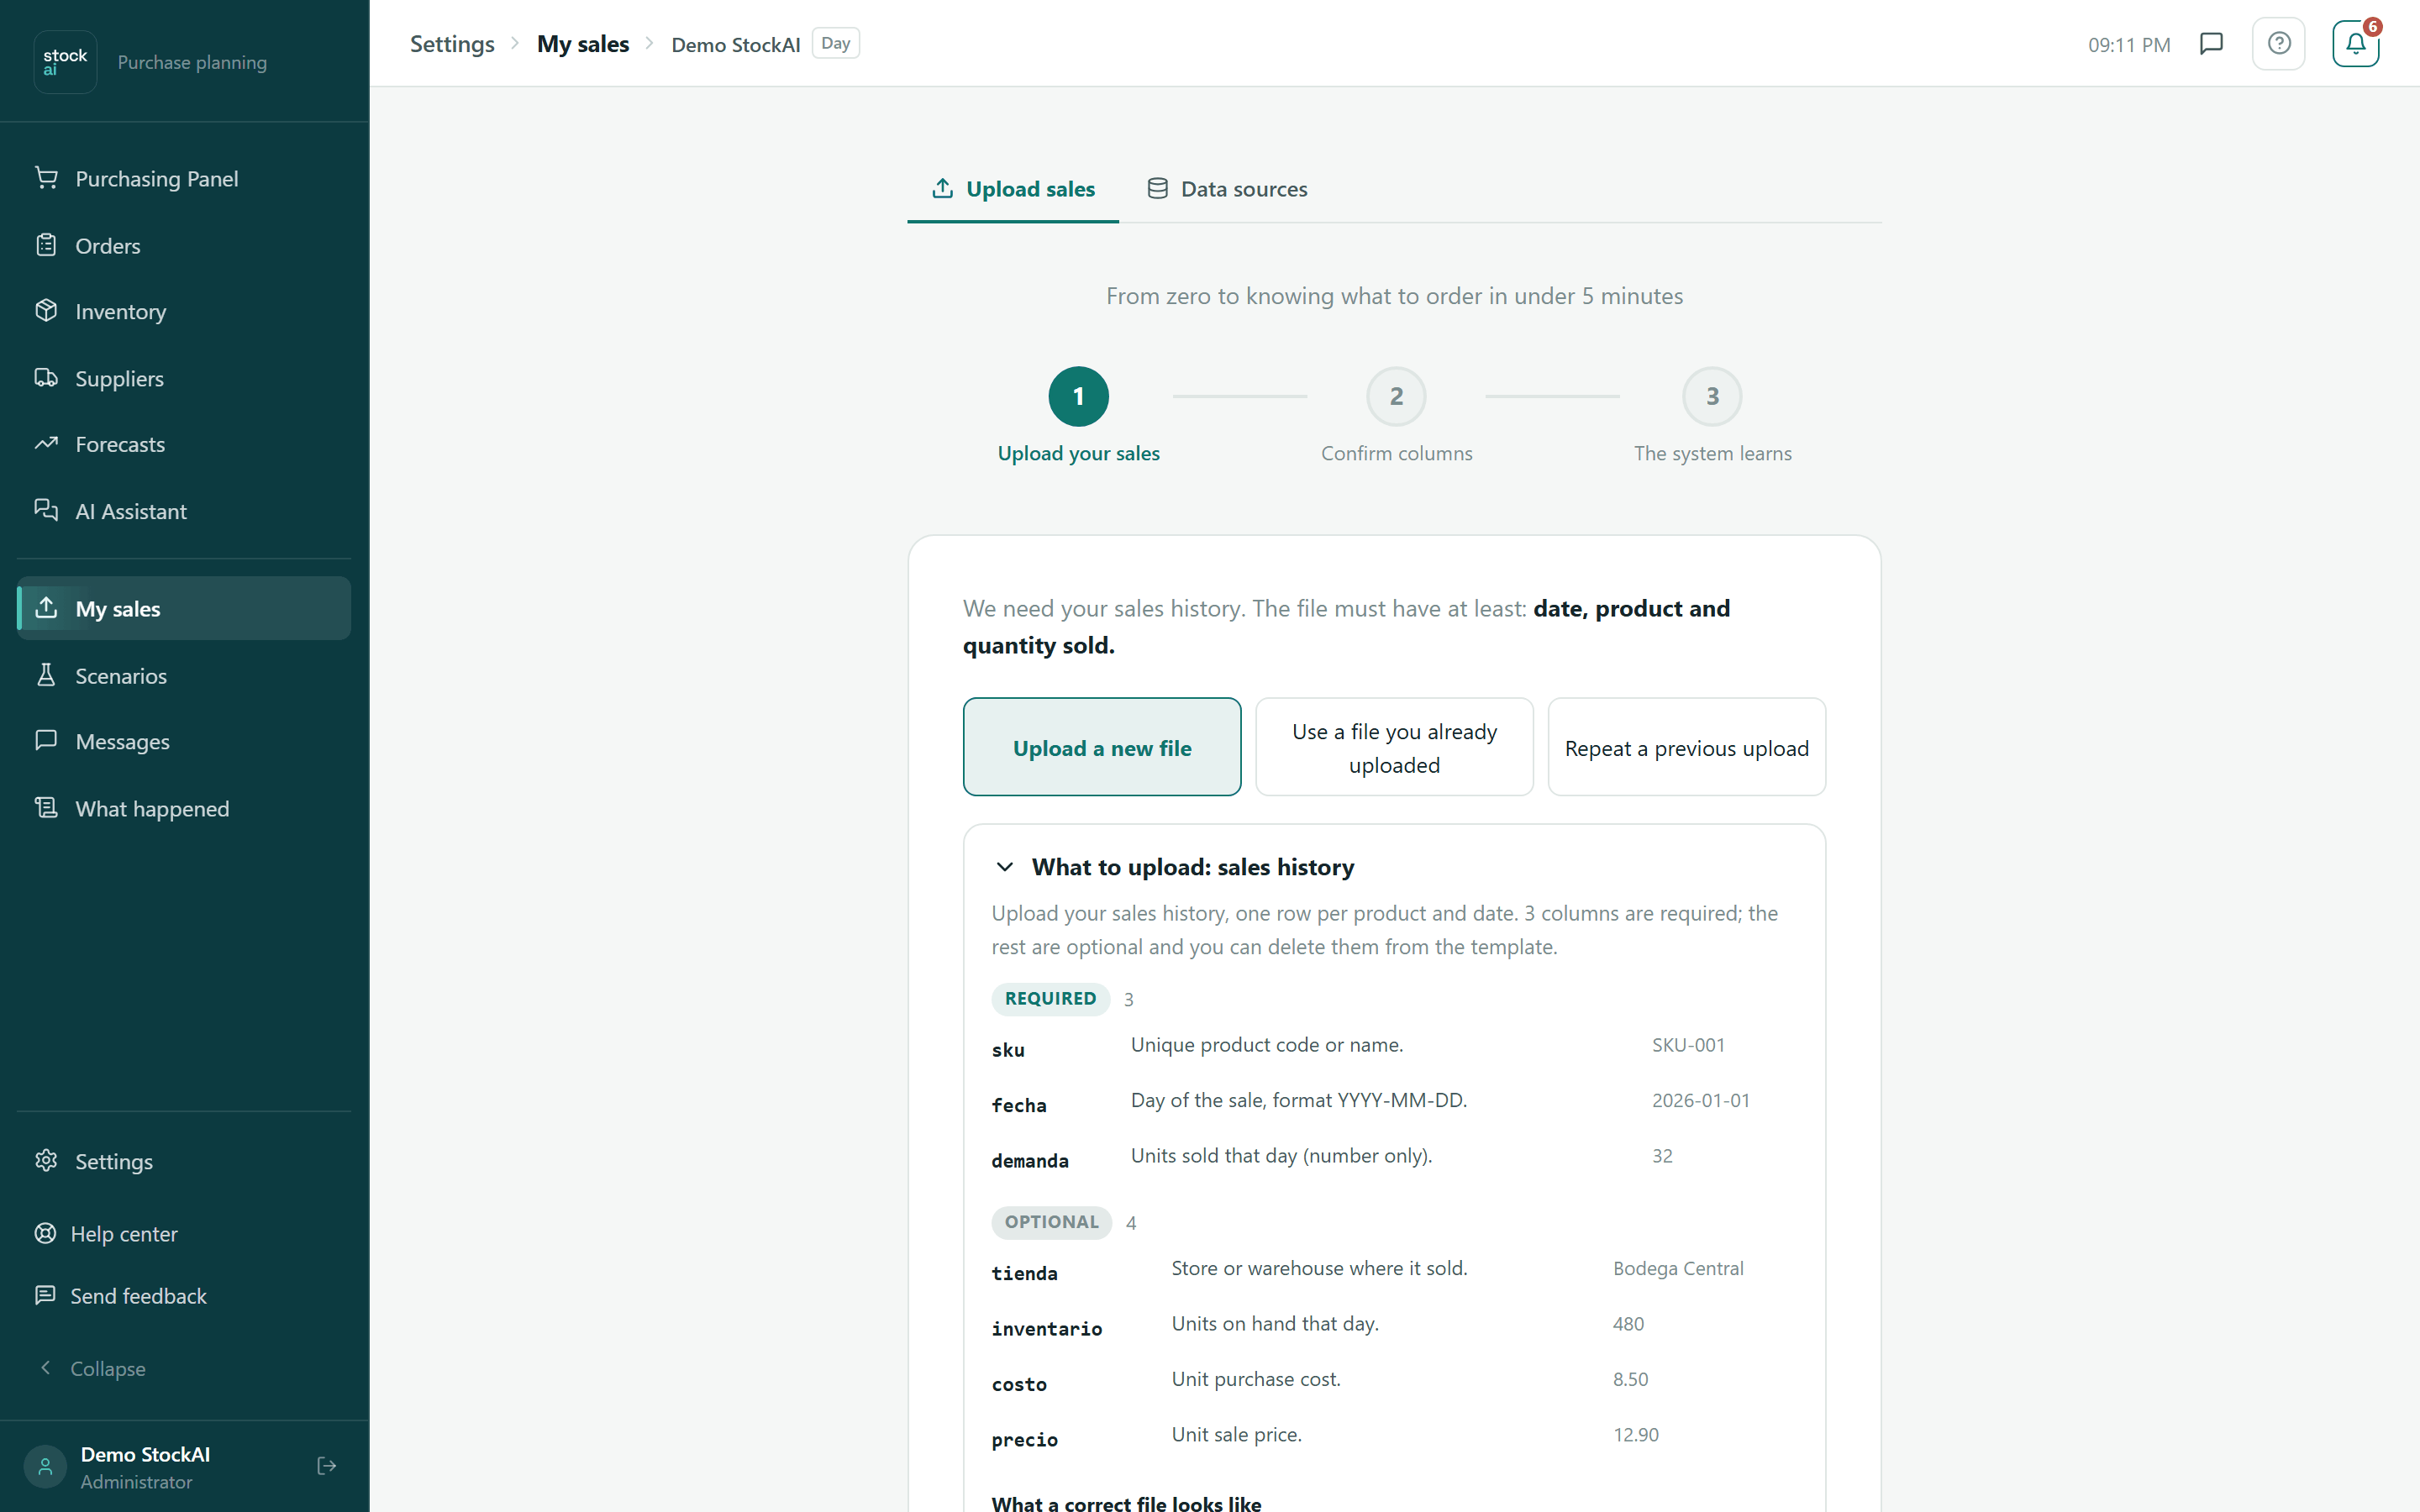
The file you need
A CSV or Excel file (.xlsx, .xls) with at least date, product and quantity sold, one row per product and date. The screen’s guide shows the Required and Optional columns, “What a correct file looks like”, the “Before uploading, check that…” list and the Download CSV template and Download Excel template (.xlsx) buttons. An example of how it should look sits at the bottom.
Before uploading, the browser checks the CSV and tells you row by row what it finds (“row 214: invalid date…”), with the template at hand to fix it.
Step 1: Upload your sales
If you already have data, up to three tabs appear at the top:
- Upload a new file
- Drag the file onto the zone or click to choose it. You will see “File selected: …”.
- Use a file you already uploaded
- Pick one of your files (with its rows and upload date) and click Use: no need to upload it again.
- Repeat a previous upload
- Runs the numbers again with the same file and columns as a finished run; click Repeat. You only change the horizon or detail in Options.
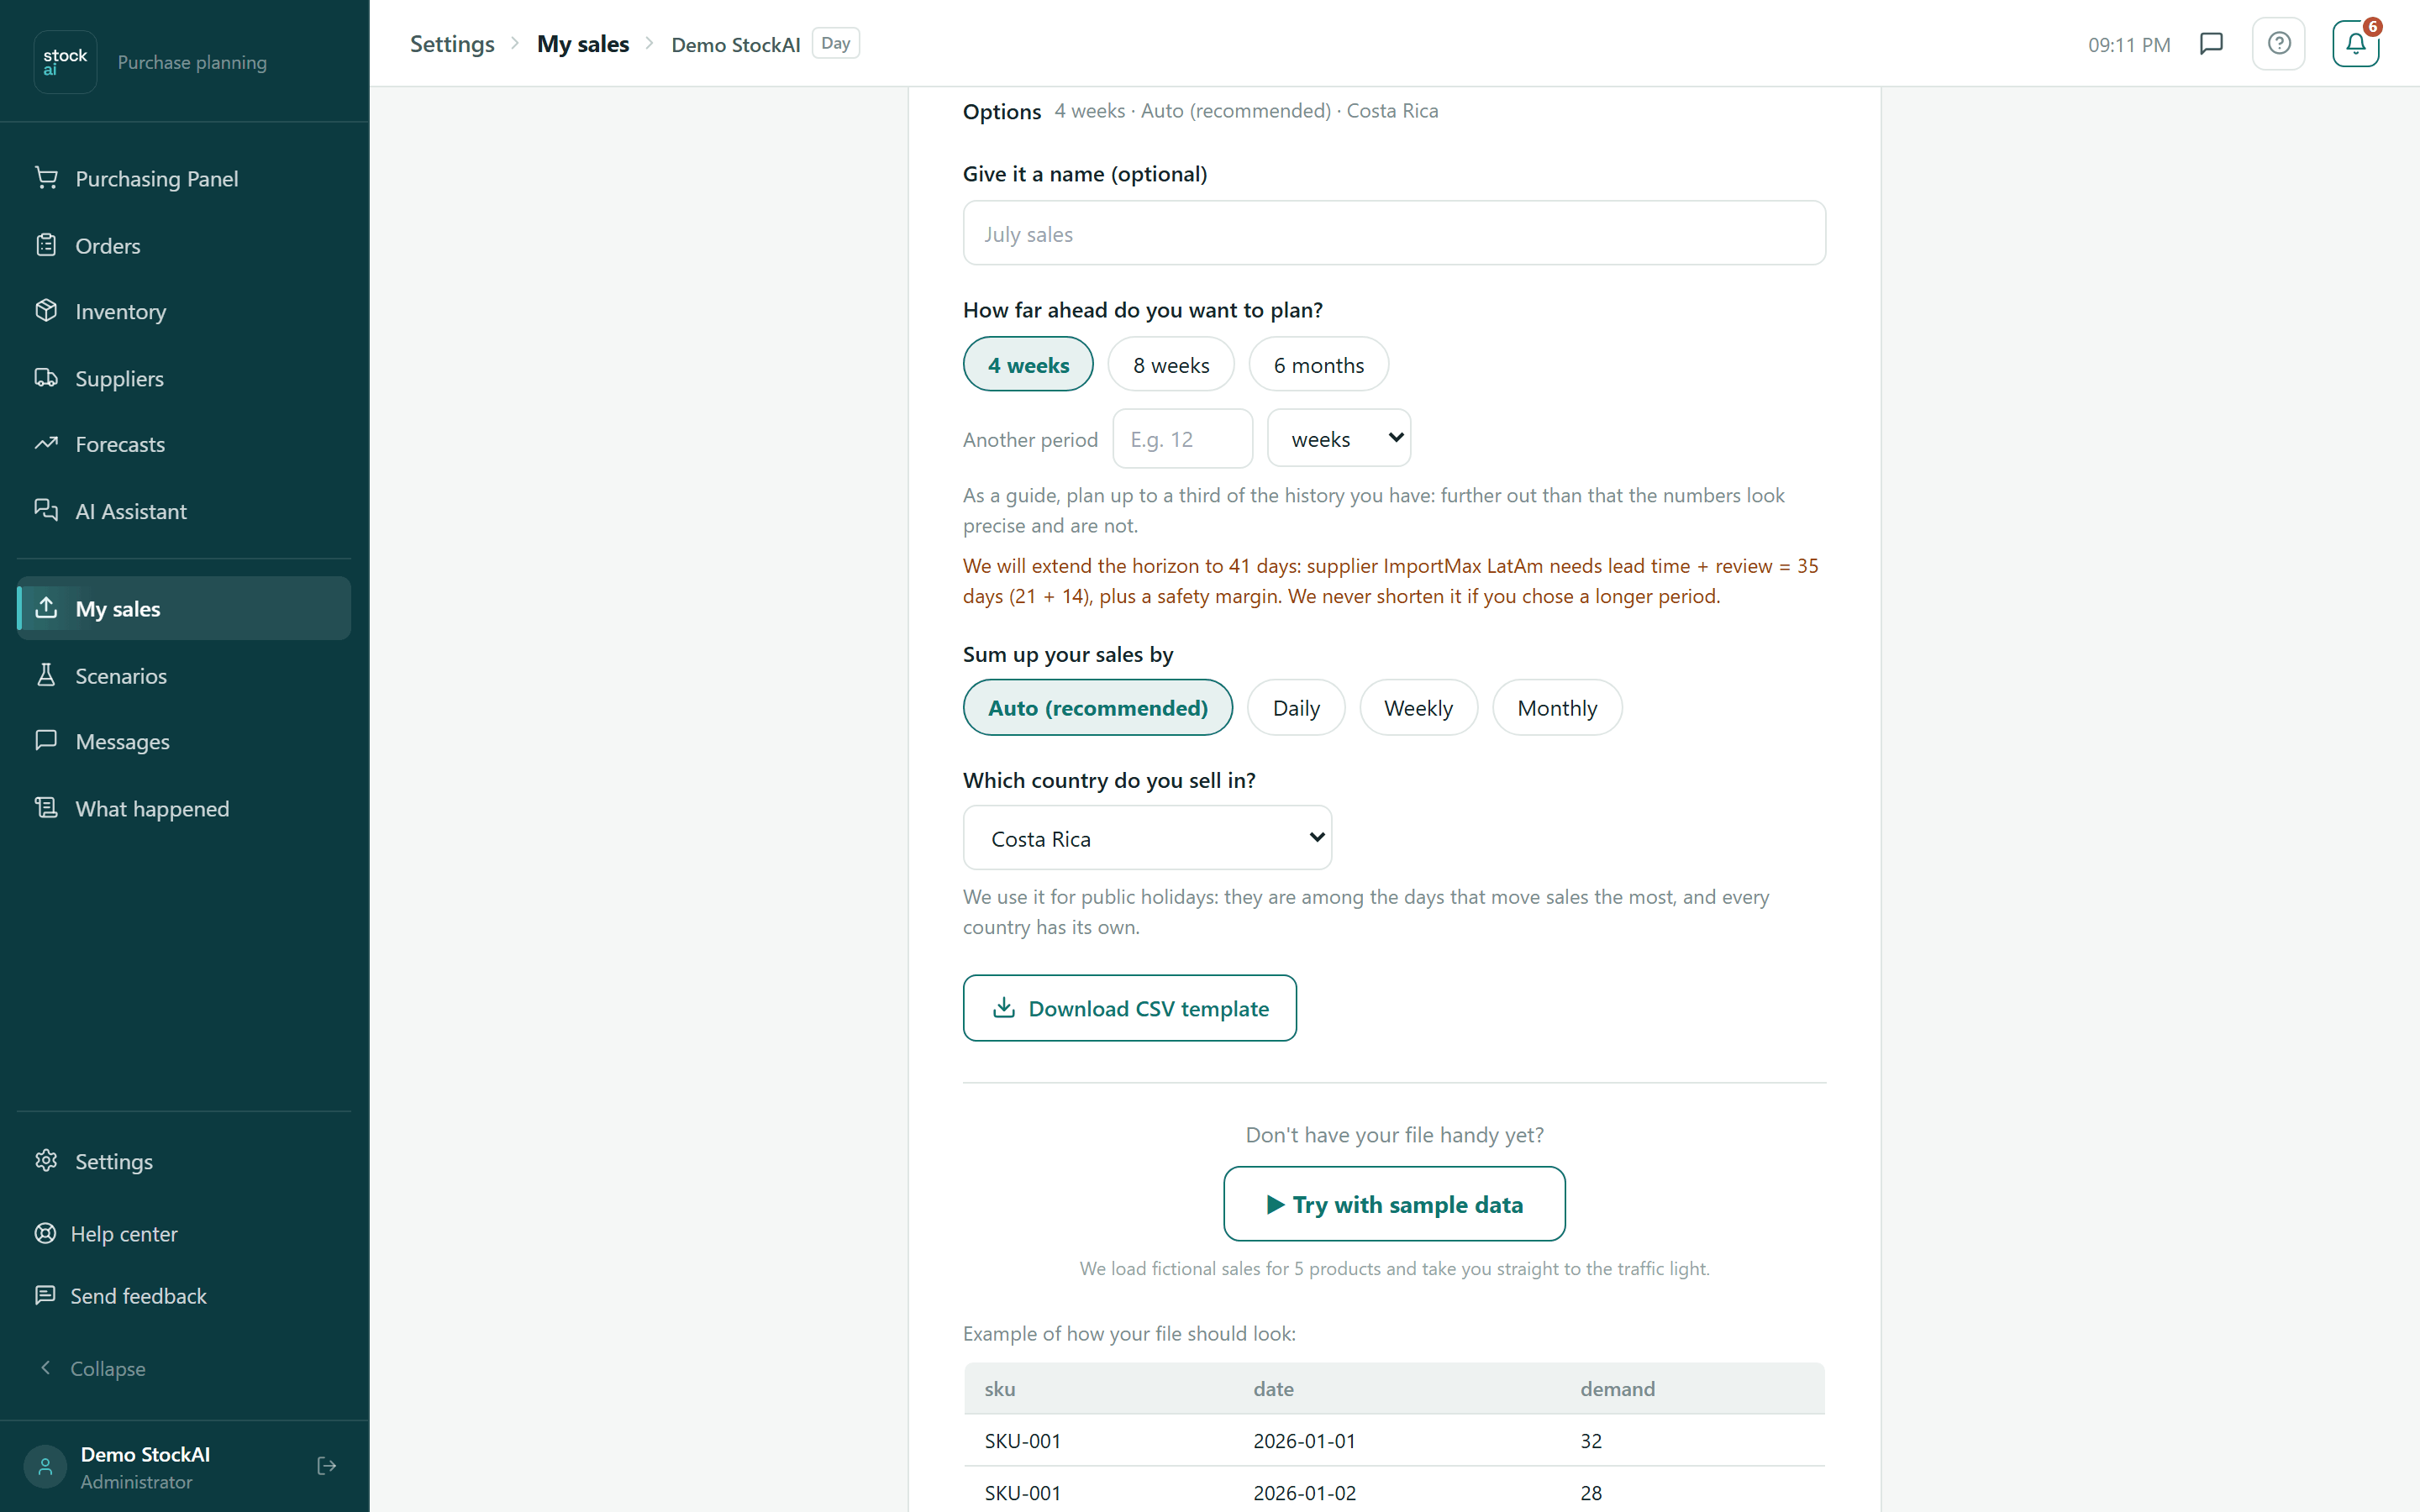
Expand Options (next to the title you see the current choice, for example “8 weeks · Auto (recommended) · Costa Rica”) to set:
- Give it a name (optional)
- The run’s name, for example “July sales”.
- How far ahead do you want to plan?
- 4 weeks, 8 weeks, 6 months or Another period (a number of days, weeks or months; 365 days at most). As a guide, plan up to a third of the history you have. Each detail level has a reach: daily goes to 90 days, weekly to 26 weeks and monthly to 12 months; if you ask for more, the screen says how far it will go. If a supplier’s or product’s lead time requires it, StockAI extends the horizon and says so; it never shortens it.
- Sum up your sales by
- Auto (recommended), Daily, Weekly or Monthly.
- Which country do you sell in?
- Costa Rica, Colombia, Mexico, Peru, Chile, Argentina, Ecuador, Guatemala, Panama, Dominican Republic, Spain or United States. It is used for public holidays, which are among the days that move sales the most.
When you upload (or pick) a file, StockAI reads it. If it recognises the three required columns with certainty, it jumps straight to step 3 and tells you which ones it used (“We recognised the columns of your file: product…, date… and quantity sold…”) with the “Change columns” link to go back. Otherwise it takes you to step 2.
Step 2: Confirm columns
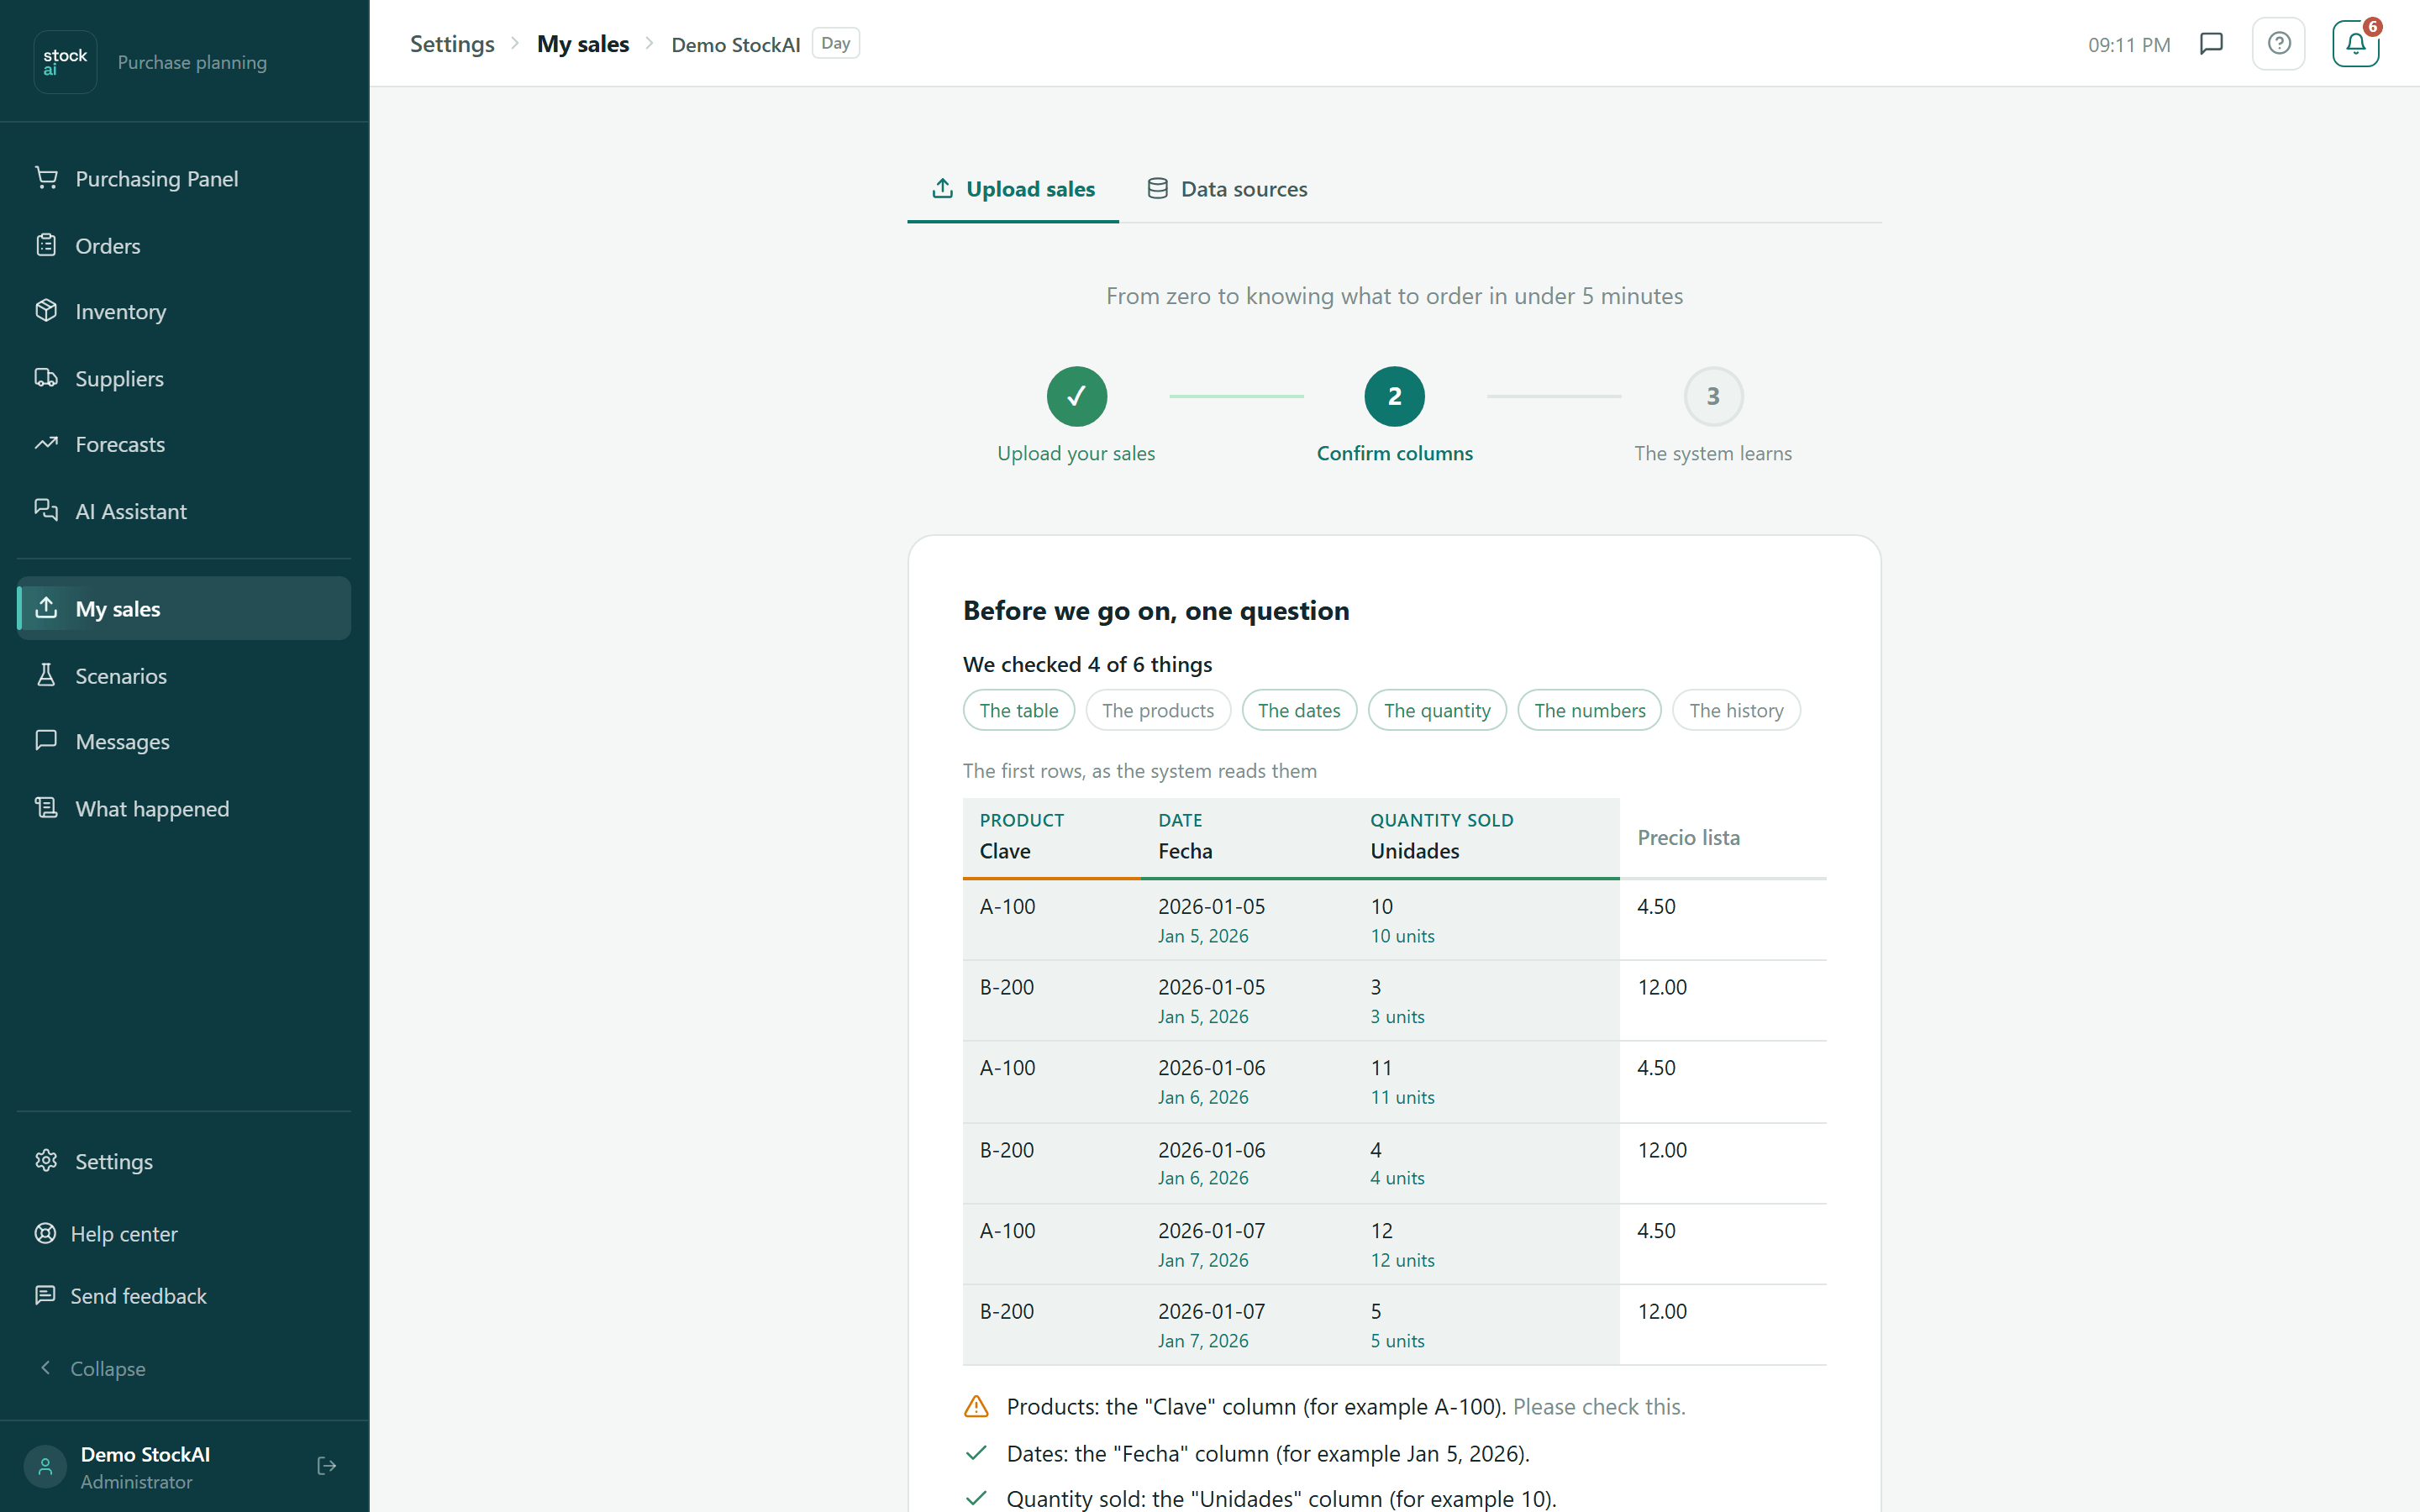
StockAI shows how it read the file: “We read N products, N days, from … to …”, “We checked N of M things”, the first rows as the system reads them, and one question per doubt (for example which column holds the units, or which sheet of an Excel file to use). What it fixed on its own appears under “What we did for you”: title or total rows ignored, Excel dates converted, decimal commas, leading zeros in codes, period columns turned into rows, among others. “Use my file exactly as it is” undoes those fixes.
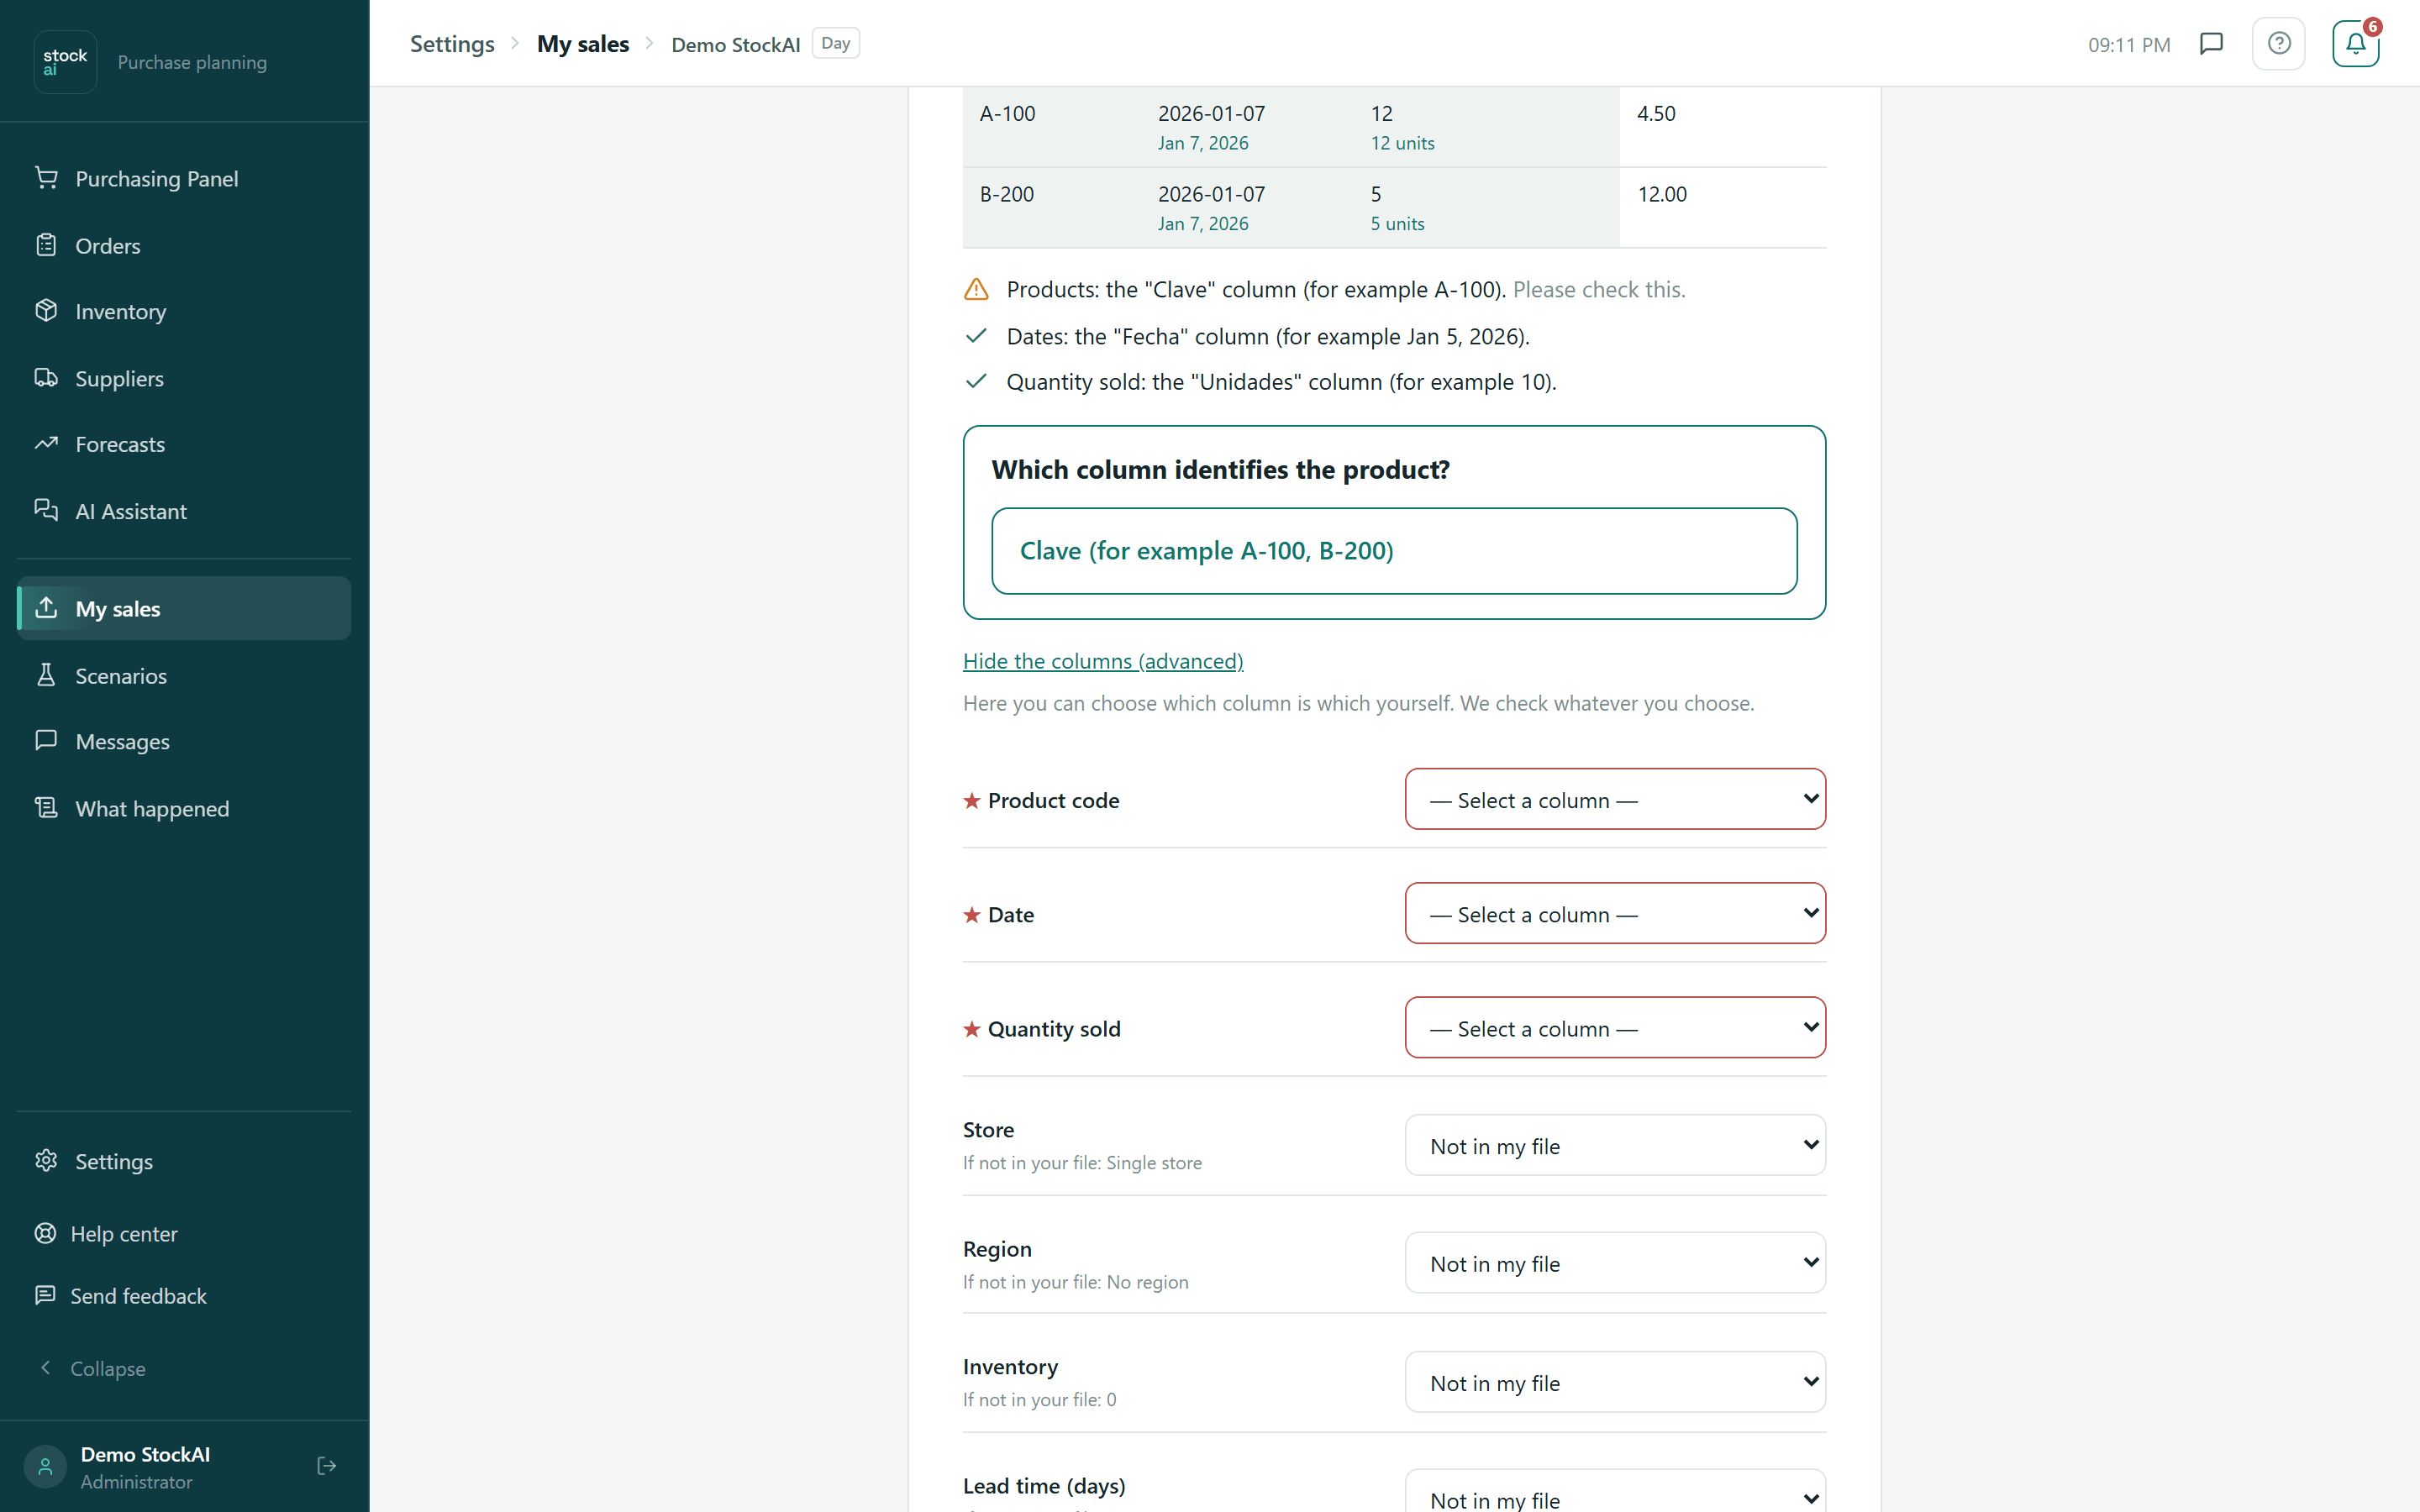
“Show all columns (advanced)” opens the full list so you choose which column is which yourself:
- ★ Product code, ★ Date, ★ Quantity sold
- Required (starred, and outlined in red while missing).
- Store, Region
- If missing: a single store, no region.
- Inventory
- The stock in the file; if missing, 0.
- Lead time (days)
- If missing, 15 days.
- Price, Cost, Regular price
- If missing: unknown.
- Promo price, Promotion, Promotion type, Discount
- If missing: same as the regular price, no promotion, 0%.
Every optional column can stay on “Not in my file”. If it is your usual monthly upload, StockAI reuses the previous run’s columns and says so; if the file changed format, it names the columns it no longer has.
Problems in the data
Below, the problems the system found. Those that only inform are shown as notices; those that change the forecast go under “There is something you have to decide first”, with options and the recommended one marked (for example, what to do with repeated dates with different quantities, or with negative returns). While answers are missing, the button says why it is off: “You still have N question(s) above to answer.”
- Review the reading and answer the questions.
- If a column is wrong, fix it in the advanced list: the file is checked again.
- Answer the points under “There is something you have to decide first”.
- Click “This looks good, continue →”.
Step 3: The system learns
StockAI sets up the rest of the calculation on its own and trains. The progress bar names each stage: loading the file, filling in days with no records, reviewing unusual sales and data quality, picking the best method per product, training, measuring accuracy, working out demand for the coming days and how much to order, and saving. If the file carries inventory, it also updates your stock. Do not close the tab while it says “This may take a few minutes…”.
What is configured automatically:
| Part | What is used |
|---|---|
| Columns | The ones you confirmed in step 2. |
| Features | Sales 1, 7, 14 and 28 periods back, moving averages over 7, 14 and 28, exponential averages over 7 and 14, the change from the previous period, calendar and the chosen country’s holidays. |
| Models | A global model that learns from all your products, LightGBM, Prophet, Croston (for intermittent sales) and XGBoost. The system picks the right ones per product. |
| Validation | Testing over time (walk-forward) with 3 splits, 80% for training and at least 20 records of history. |
| Forecast | The horizon and detail from Options. The period views are computed (for example daily and weekly); you are taken to the result as soon as the first one is ready and the rest continues in the background. |
| Business | Service level 95%, lead time 15 days, holding cost 20%, and running out costs 3 times more than having spare. Later, set the real values per product and supplier in Inventory and Suppliers. |
If the calculation fails you see “The calculation failed:” with the reason and the “Try again” button, which reuses the file already uploaded.
Related
- Upload your sales: the short version to get started.
- Granularity and How the models compete.
- File rejected: what to do when a file does not pass.
- History: every run you calculated.